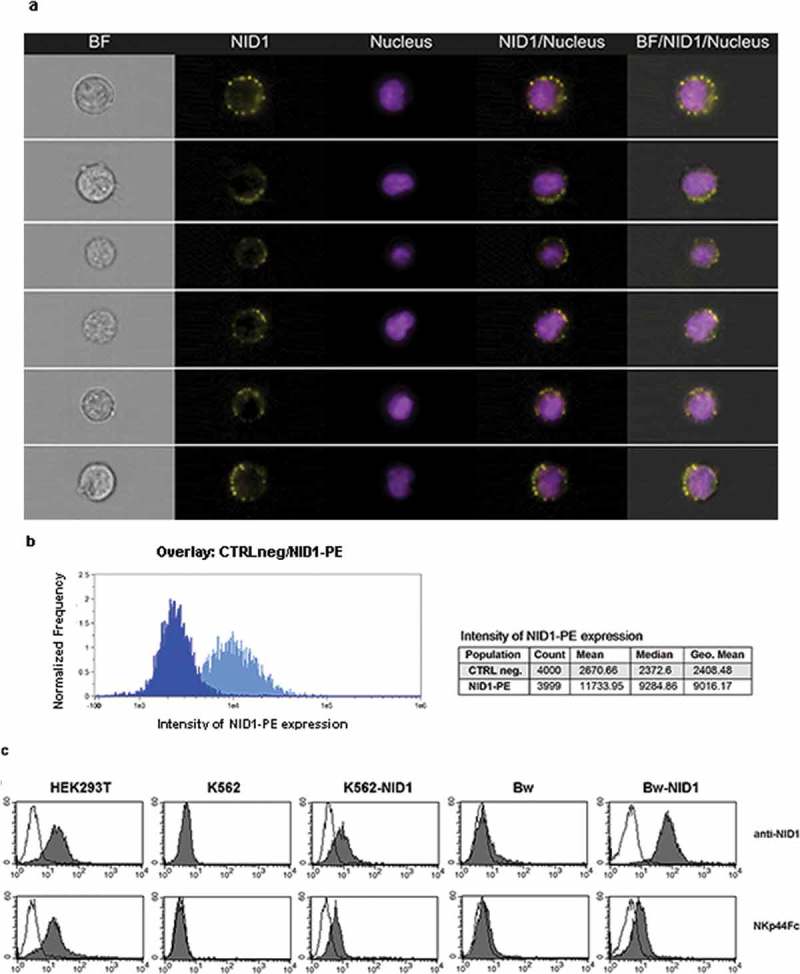
Figure 7.

Analysis of NID1 surface expression in HEK293T cell line and in NID1 cell transfectants. (A, B) HEK293T cells were stained with a NID1-specific mAb followed by PE-conjugated anti-mouse IgG1 mAb. Prior to analysis by Amnis ImageStream, cells were incubated with Hoechst 33342 nuclear dye. NID1 expression on individual single cells is shown in (A). Data show representative images from one experiment out of three performed. Histograms in (B) represent total intensity of NID1 immunostaining for HEK293T cells as compared to isotype control. (C) HEK293T, K652, K562-NID1, Bw, and Bw-NID1 cells were stained with a NID1-specific mAb or with NKp44Fc followed by the appropriate isotype-matched PE-conjugated secondary mAb. Samples were analyzed by flow cytometry. Grey profiles represent cells stained with anti-NID1 or with NKp44Fc, while white profiles correspond to isotype control. One representative experiment of four is shown.
