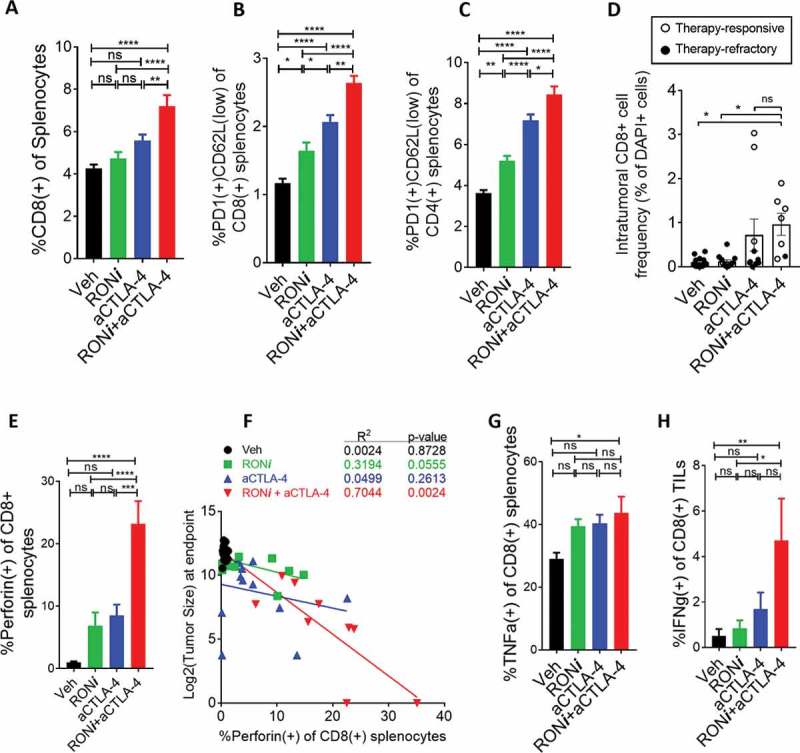
Figure 4.

RONi+aCTLA4 therapeutic efficacy is associated with improved CD8 + T-cell responses. A. Flow cytometric analysis of CD8 + T cell frequency in spleens at the experimental endpoint, shown for each treatment group. CD8+ cells were pre-gated on single live cells; complete flow cytometry plots are shown in Fig S8. B-C. Frequency of PD1-expressing CD62L(low) cells within the splenic CD8+ (B) and CD4+ (C) T-cell compartments. D. Immunofluorescence analysis of CD8+ cells within tumors that remained after treatment. The percentage of CD8+ cells within the tumor was calculated as a ratio to DAPI+ cells. Data points represent individual mice. Unfilled points represent tumors that responded to therapy and black filled points depict refractory cases as shown in Figure 3. Representative images of immunofluorescence are shown in Fig S9. E. Frequency of perforin-expressing CD8+ T-cells in spleens at the experimental endpoint, shown for each treatment group. F. Correlation plots showing log2-transformed tumor size versus perforin+CD8+ splenocyte frequency at the endpoint. G. Frequency of TNFα+ expressing splenic CD8+ cells following restimulation with PMA and ionomycin. H. Frequency of IFNγ+ tumor-infiltrating CD8 + T-cells following restimulation with the tumor-specific NP118 peptide. Data in G and H were normalized to unstimulated controls for each mouse, and flow cytometry plots and gating for intracellular stains are shown in Fig S10. Statistical comparisons were performed with one-way ANOVA with Tukey’s correction. (ns) p > 0.05, (*) p ≤ 0.05, (**) p ≤ 0.01, (***) p ≤ 0.001, (****) p ≤ 0.0001.
