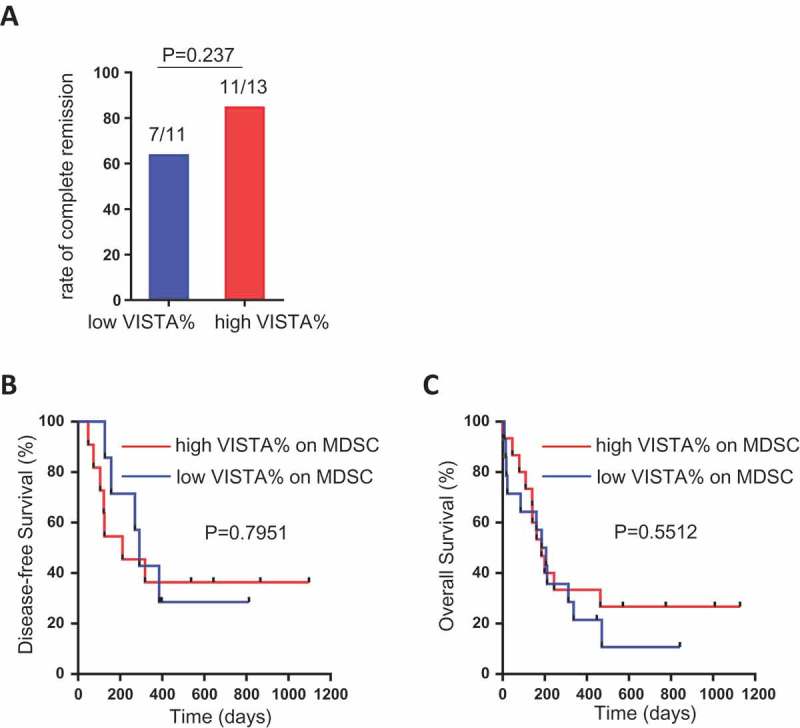
Figure 6.

Association between VISTA expression on MDSCs and clinical outcome in AML patients. AML patients were divided into high-VISTA vs. low-VISTA subgroups by using the median value of VISTA expression on MDSCs. (A) Shown is the rate of complete remission after induction chemotherapy in high-VISTA vs. low-VISTA subgroups. (B, C) Shown are the disease-free survival (DFS) and overall survival (OS) between the high-VISTA vs. low-VISTA subgroups of patients. P value was obtained by Fisher’s exact test and Log-rank test.
