
Figure 3.
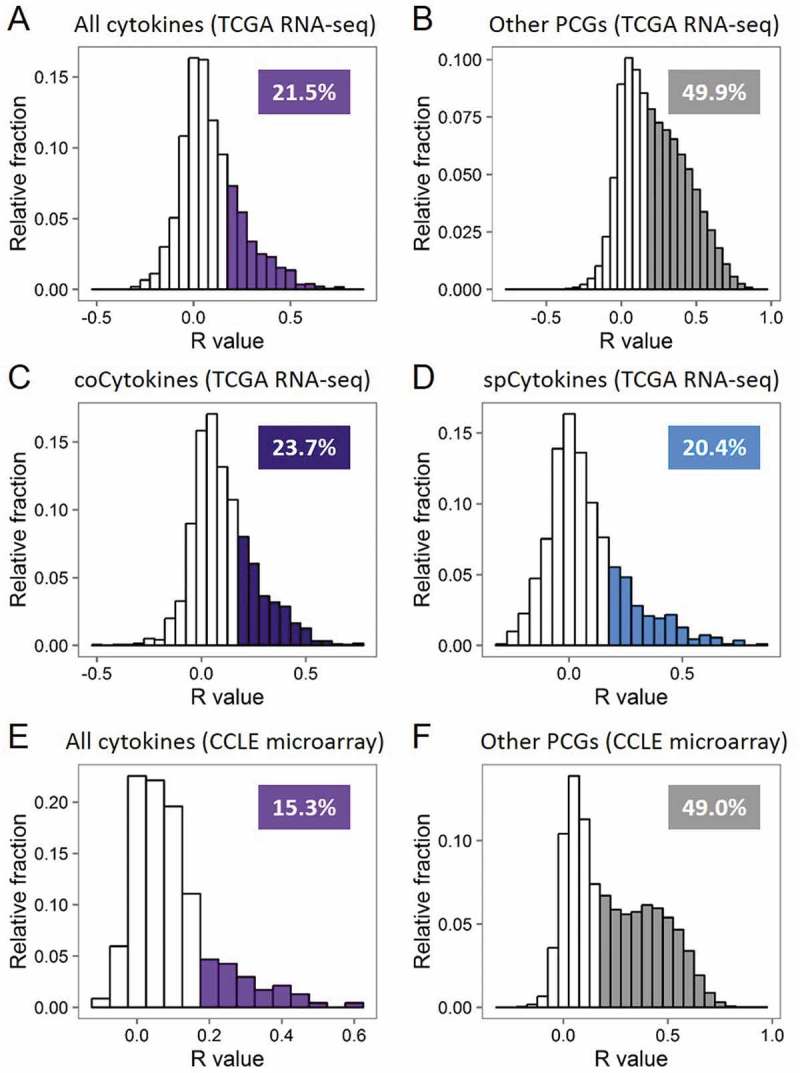
Transcript abundances of cytokines are less explained by somatic copy number (SCN) alterations. (A) Histogram showing frequency distributions of cytokines’ SCN-RNA correlation coefficients in all cancer types from TCGA. Percentages of cytokines with an SCN-RNA correlation coefficient of > 0.2 are shown and highlighted in color. (B) Histogram showing frequency distributions of other protein-coding genes (PCGs)’ SCN-RNA correlation coefficients in all cancer types from TCGA. (C) Histogram showing frequency distributions of coCytokines’ SCN-RNA correlation coefficients in all cancer types from TCGA. (D) Histogram showing frequency distributions of spCytokines’ SCN-RNA correlation coefficients in all cancer types from TCGA. (E) Histogram showing frequency distributions of cytokines’ SCN-RNA correlation coefficients in all cancer types from the CCLE. (F) Histogram showing frequency distributions of the other PCGs’ SCN-RNA correlation coefficients in all cancer types from the CCLE. The area of color in the histogram is approximate to the percentage of the number of genes with SCN-RNA correlation coefficients of > 0.2.