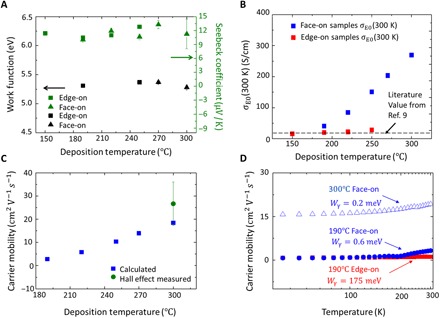
Fig. 3. Theoretical modeling to study the charge carrier transport process in oCVD PEDOT.

(A) Left y axis: Work function of oCVD PEDOT samples deposited at different temperatures. Right y axis: Room temperature Seebeck coefficient of the PEDOT samples. (B) Calculated transport coefficient σE0 at 300 K. (C) Calculated room temperature carrier mobility of face-on samples deposited at different temperatures and Hall effect–measured carrier mobility. The error bar is based on three samples. (D) Calculated carrier mobility as a function of measurement temperature and fitted energy barrier Wγ of intercrystallite charge carrier transport.
