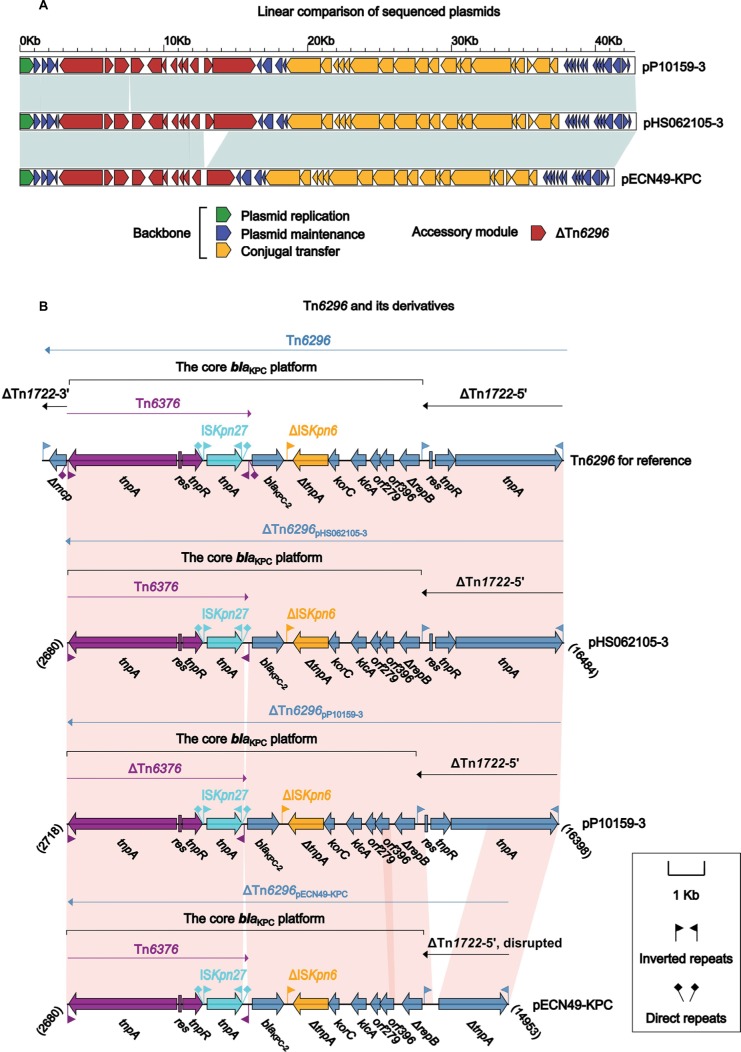
Figure 3.
Comparison of pP10159-3 with pHS062105-3 and pECN49-KPC.
Notes: Shown are linear comparison of the three sequenced plasmids pP10159-3, pHS062105-3 and pECN49-KPC (A), and that of Tn6296 and its three derivatives from these thee plasmids (B). Genes are denoted by arrows. Genes, mobile elements and other features are colored based on function classification. Shading denotes regions of homology (>95% nucleotide identity). Numbers in brackets indicate the nucleotide positions within the corresponding plasmids.

