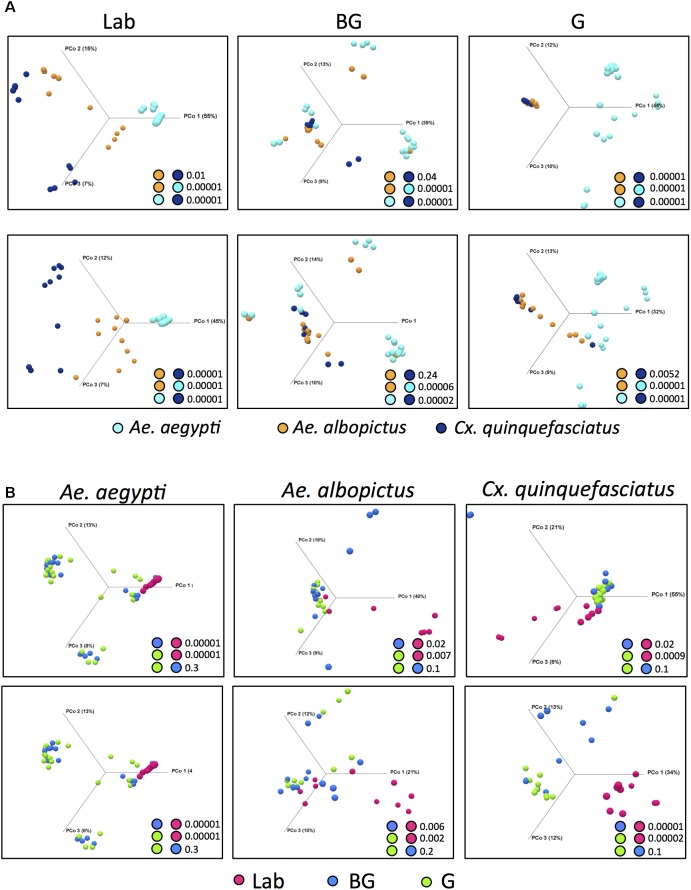
FIGURE 2.
Principal Coordinates Analysis (OTU level) using Bray-Curtis dissimilarity, comparing identified OTUs within a group (A) or species (B). PERMANOVA significance values for pairwise comparison are reported in the lower right corner for each analysis. For (A,B), upper plots include Wolbachia while Wolbachia has been computationally excluded in the lower plots.

