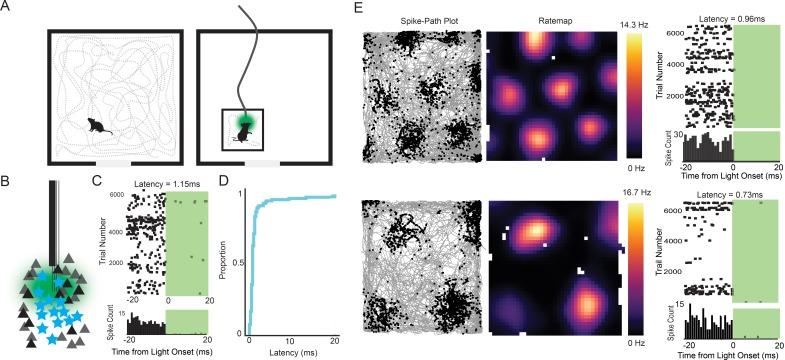
Figure 2. Experimental design and examples of tagged grid cells.
(A) Mice were run in a 0.8 or 1 m box for 30–40 min while cells in the MEC were recorded. The mice were then connected to a patch cable and placed in a towel-lined holding box for an optogenetic tagging session. The tagging session consisted of 10–20 ms light pulses delivered thousands of times at 1–4 Hz. (B) Cartoon of the experimental logic. ArchT-expressing stellate cells (cyan stars) should be immediately inactivated by light delivery while neighboring pyramidal cells (black triangles) should not, allowing functional identification of stellate cells. (C) Raster plot (top) and histogram (bottom; bin size = 1 ms) for an example tagged cell. The cell was silenced with an estimated latency of 1.15 ms. (D) Cumulative histogram of latencies for all inhibited cells. Median latency was 0.85 ms. (E) Two further example tagged grid cells (spike-path plots on left and color-coded rate maps with colorbar in the middle) and their corresponding raster plots and histograms from the tagging session (right). Both cells had sub-millisecond latencies.


