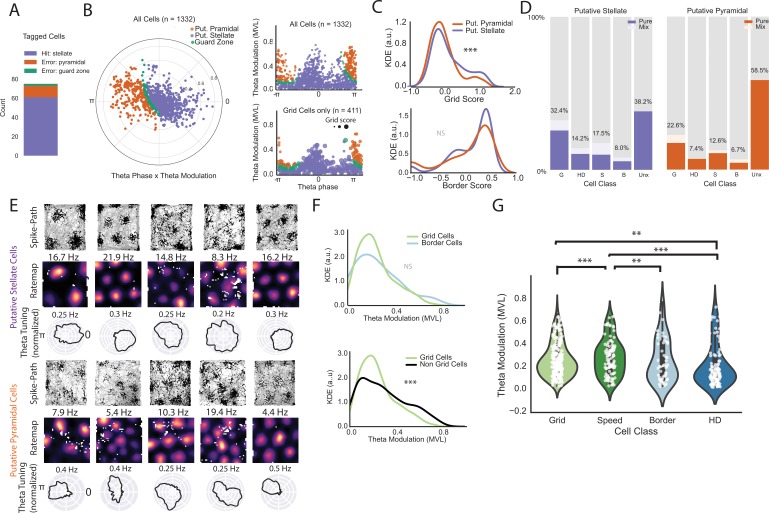
Figure 4. Classifier performance and comparison of theta phase locking for different functional classes on an extended layer II dataset.
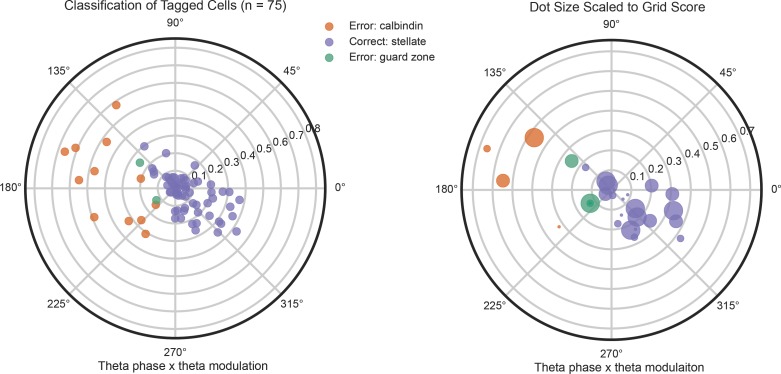
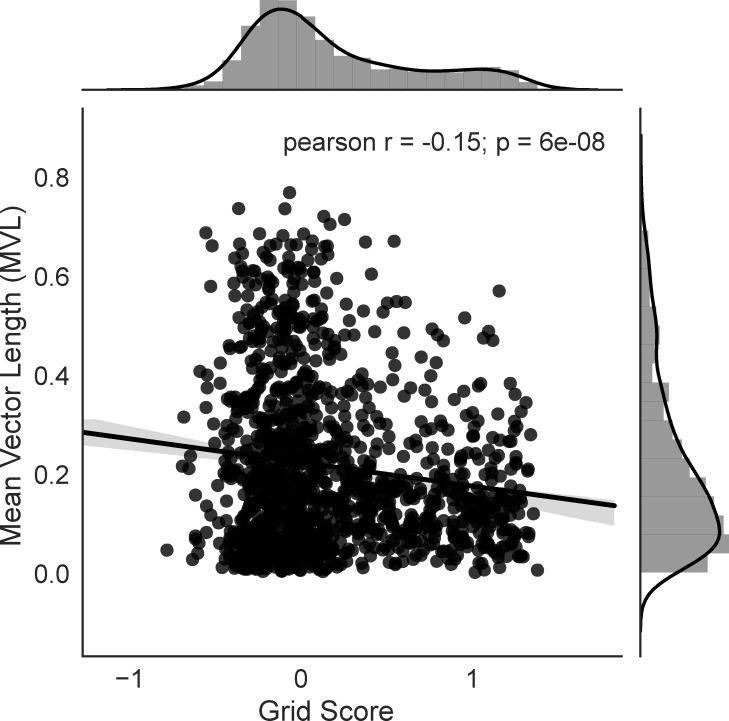
(A) Classifier performance on the population of tagged cells. Numbers of cells correctly identified as stellate cells (purple), incorrectly identified as pyramidal cells (orange), and in the guard zone (green) are shown in the stacked bar chart. (B) Preferred theta phase (angle) and strength of theta phase modulation (mean vector length, MVL, radius, peak of the oscillation is 0 and trough is pi) for all cells in in the extended layer II dataset. The data for all cells are presented in circular form on the left and unwrapped on the top right. Cells are color-coded based on their classification into putative stellate and pyramidal categories (classification based on phase locking to local theta oscillation; see text). Cells showed some clustering around the peak (0) and trough (pi). Bottom right shows the distribution of grid cells only where the dot size is proportional to the grid score. (C) Kernel density estimates (KDE) of grid scores (top) and border scores (bottom) for putative stellate cells and putative pyramidal cells. (D) Breakdown of the two groups by functional category. (E) Example grid cells (path plots and color-coded rate maps) with theta phase histograms (normalized such that the area under the curve equals 1 for comparison of depth of modulation between cells) for the two categories of cells. Peak rates for rate maps are indicated above the maps. Clear grid cells exist in both populations and exhibit a variety of theta phase preferences. (F) KDEs showing that grid cells exhibit no significant difference in theta modulation from border cells (top) but less theta modulation than non-grid cells as a group. (G) Violin plots with individual data points in white overlaid for theta modulation by cell class (shaded regions give the kernel density estimates and the white dots are individual data points). We only included pure cells (cells that classified criteria for only one cell type) in this analysis to preserve independence between groups. (**=P < 0.01, ***=P < 0.001, two-sided Mann-Whitney U-test).


