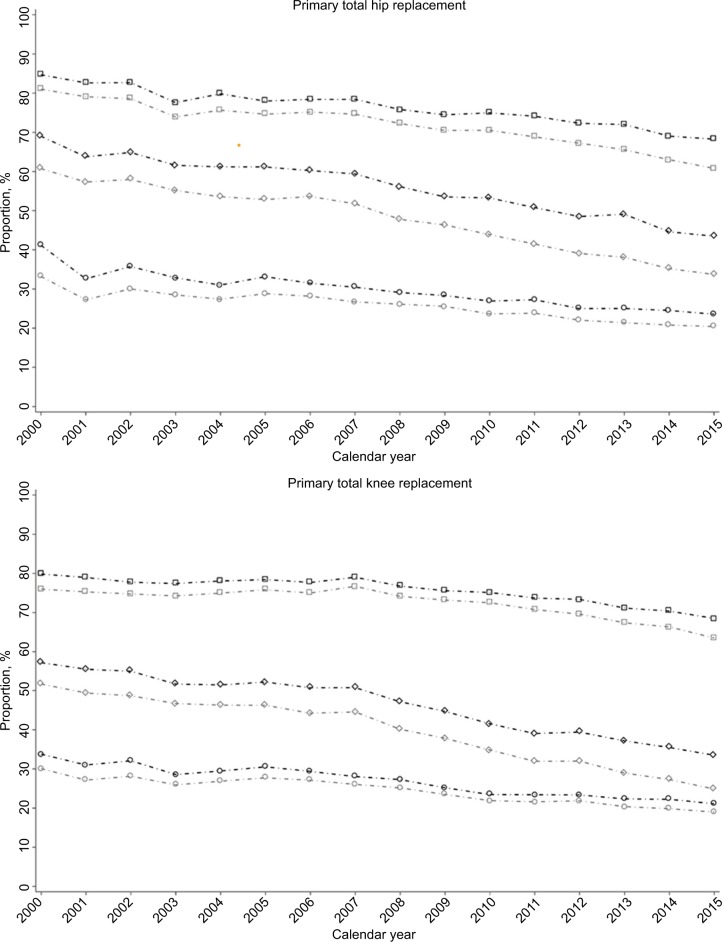
Figure 1.
Proportion with OAs diagnosis among patients with an incident primary total hip and knee replacement between 2000 and 2015.
Notes: Square, diamond, and circle line represents proportion of clinical OA, diagnosed OA (any joint) and diagnosed OA (joint-specific), respectively. Black and gray lines indicate the proportion with diagnosis in the 10 years and 3 years prior to index joint replacement, respectively.
Abbreviation: OA, osteoarthritis.

