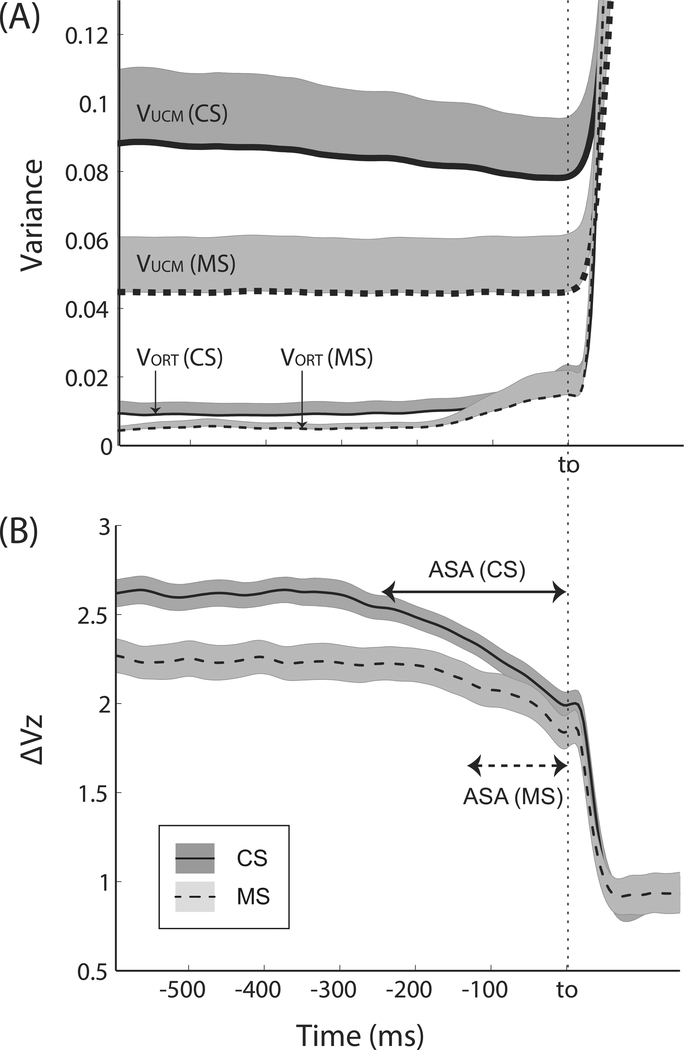
Figure 3.
(A) Two variance components (VUCM and VORT) and (B) the synergy index (ΔVZ) during the quick force pulse production tasks for the MS patients and CS. Averages across subjects within each group are presented with standard errors shades. Average data across both hands were used for each subject. Note the difference in ASA between MS and CS groups before the initiation of the force pulse (t0).

