
Figure 2.
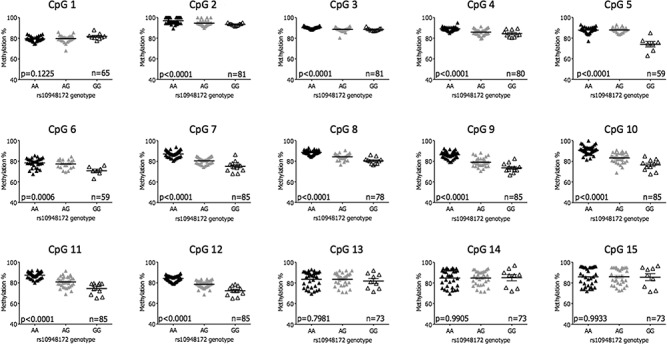
Definition of the 5′ and 3′ limits of the SUPT3H/RUNX2-DMR in OA synovium DNA. Graphs display the percentage methylation at each of the 15 CpG sites stratified by genotype at the OA association SNP rs10948172 (A/G). P-values were calculated using a one-way analysis of variance (ANOVA) with a Bonferonni post-test correction. The horizontal line represents the mean methylation and the standard error of the mean (SEM). n, the number of patients analysed per CpG.