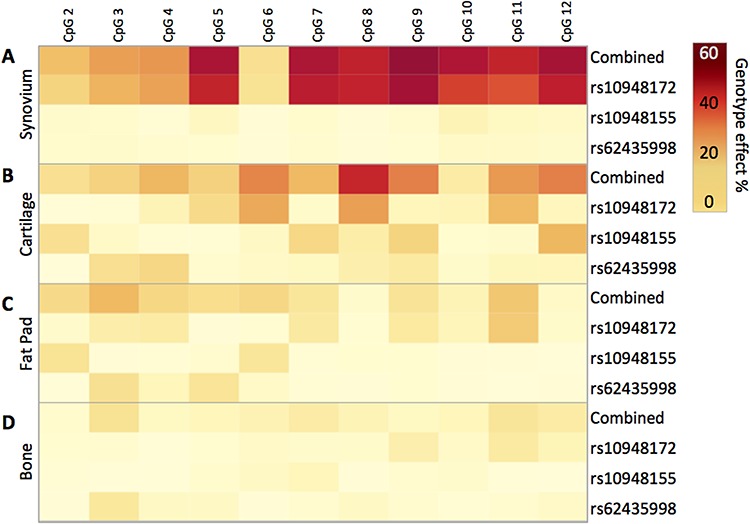
Figure 3.

The influence of genotype upon methylation at the SUPT3H/RUNX2-DMR. Heat map displaying the percentage effect of genotype at rs10948172, rs10948155 and rs62435998, plus all three SNPs combined, at CpG2 to CpG12 in the following: (A) synovium (n = 59 patients), (B) cartilage (n = 30 patients), (C) fat pad (n = 44 patients) and (D) bone (n = 25 patients). The relative contribution of each SNP was calculated using the log worth and incremental R2 statistics. The incremental improvement in R2 values capturing explained variability was then plotted. Statistical analyses were performed with the aid of SAS JMP Statistical Data Visualization Software.
