
Figure 5.
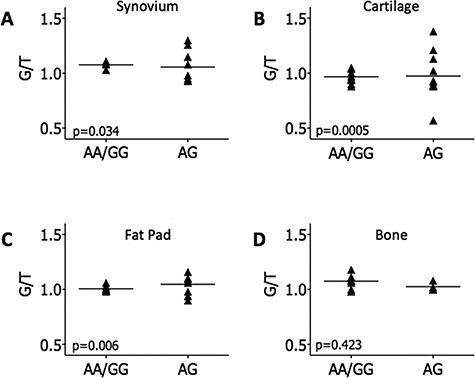
AEI analysis of RUNX2 using the transcript SNP rs1200428. AEI was carried out in rs1200428 heterozygous OA patient samples from the following tissues: (A) synovium (n = 13 patients), (B) cartilage (n = 22 patients), (C) fat pad (n = 17 patients) and (D) bone (n = 12 patients). The ratio of G/T alleles was determined in patient DNA and cDNA and each cDNA ratio was normalized to that measured in the DNA of the same patient sample. These data were stratified by genotype at the association SNP, rs10948172. Each patient DNA and cDNA sample was analysed in triplicate and the mean cDNA ratio per patient is plotted. P-values were calculated using an unpaired t-test of variances. Horizontal lines represent the mean values across patients.