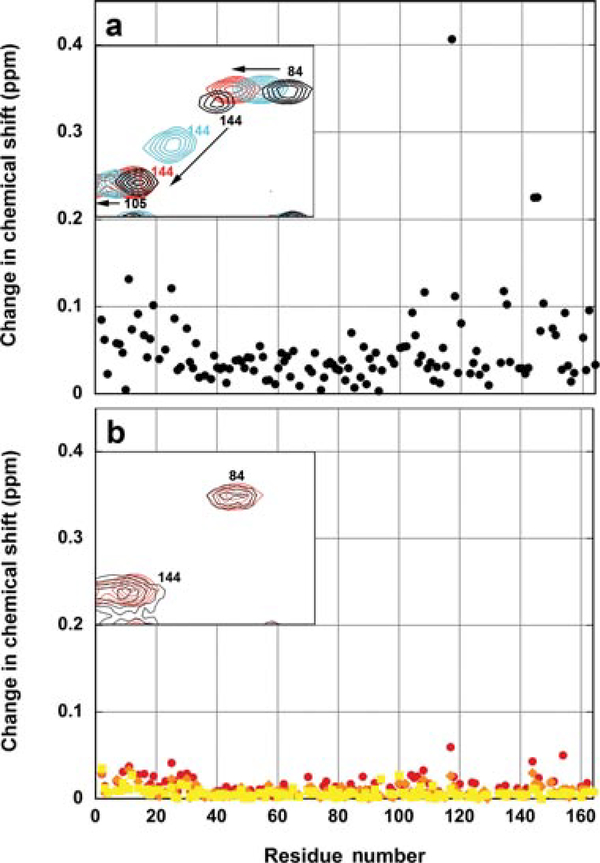
Figure 5.
(a) The effect of salt on the chemical shift values for residues in WT* T4 lysozyme. The graph shows the magnitude of the change in chemical shift due to salt (0 vs. 200mM) as a function of position in the protein in the absence of adjuvant. The inset shows a small region of the spectra containing the peaks for three residues (84, 105, and 144) at three salt concentrations 0mM NaCl (black), 100mM NaCl (cyan), and 200mM NaCl (red) in MOPS buffer. (b) Chemical shift changes of desorbed WT* T4 lysozyme in the presence of adjuvant relative to the adjuvant-free solution state sample in the presence of identical concentrations of NaCl. Red—100mM NaCl. Orange—150mM NaCl. Yellow—200mM NaCl. The inset shows a small region of the 15N HSQC spectrum of the protein as in panel (a) in the presence of 200mM NaCl with adjuvant (black) and without adjuvant (red).

