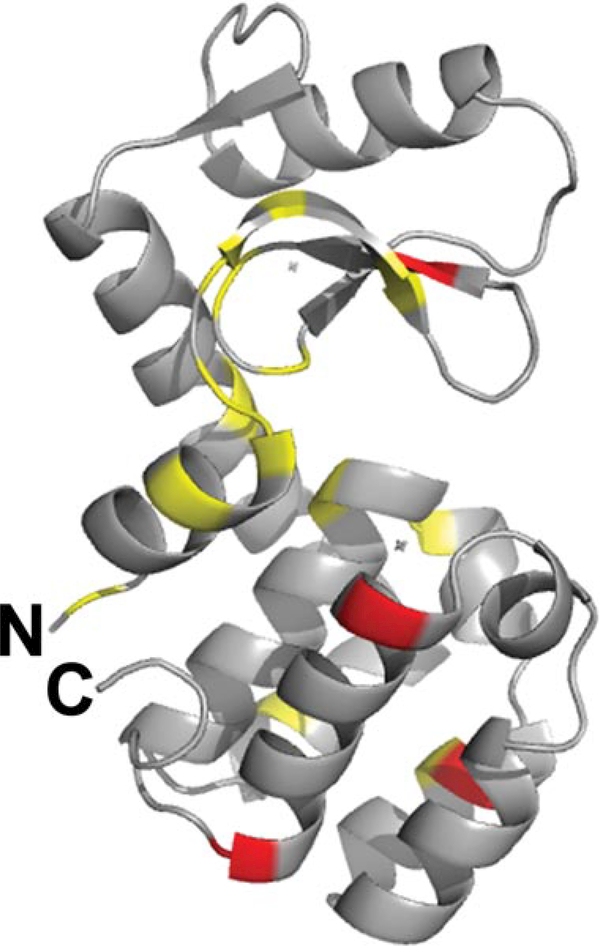
Figure 6.
The adjuvant-dependent differences in chemical shifts at 100mM NaCl mapped onto the structure of the protein. Residues with the largest chemical shift changes (0.04–0.06 ppm) are shown in red and residues with moderate changes (0.025–0.04 ppm) are shown in yellow. The figure was generated using Pymol (The PyMOL Molecular Graphics System, version 1.2r3pre; Schrödinger, LLC (Portland, Oregon) using the PDB file 1L63.

