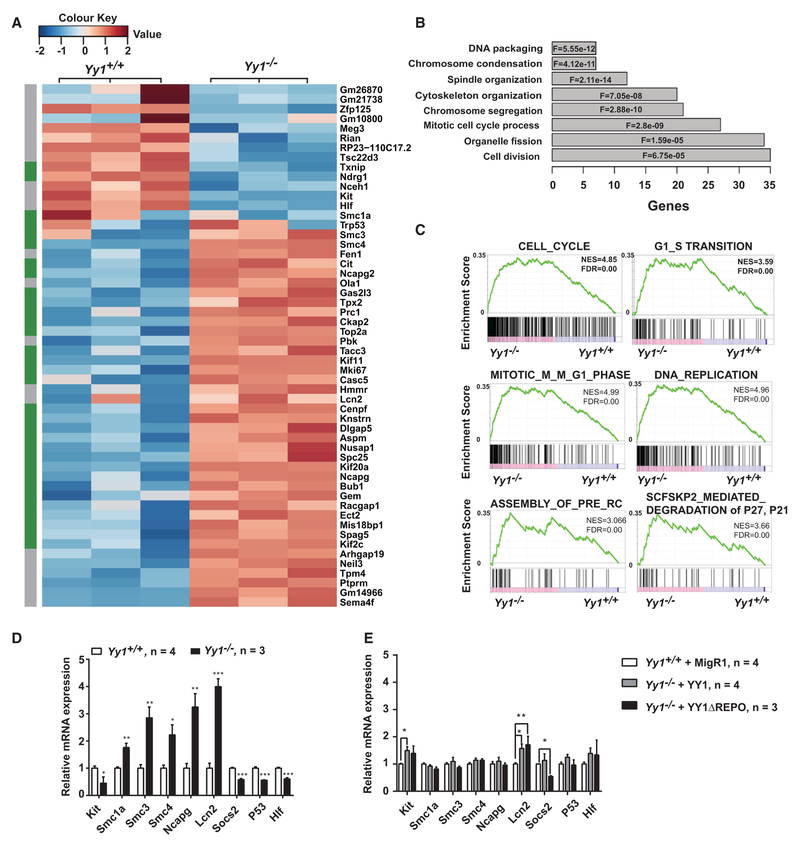
Figure 5. Yy1−/−HSCs Exhibit an Aberrant Genetic Network with Corruption of Genes Involved in Cell-Cycle Regulation $$PARABREAKHERE$$RNA-seq-based comparison of gene expression in Yy1+/+ and Yy1−/−sorted HSCs.
(A) Heatmap depicting statistically significant, differentially expressed upregulated and downregulated genes.
(B) Gene Ontology analysis of genes upregulated in Yy1−/−HSCs. The most enriched biological processes are shown with corresponding FDR values. F, FDR.
(C) GSEA shows that genes involved in cell-cycle progression and G0 to G1 phase entry are enriched in Yy1−/−HSCs.
(D) Relative mRNA expression of genes in Lin−GFP+ bone marrow cells of Yy1+/+ versus Yy1−/−.
(E) Relative mRNA expressions of genes in Lin−GFP+ bone marrow cells of Yy1+/+ + MigR1, Yy1−/−+ YY1, or Yy1−/−+ ΔREPO. Graphs show means ± SEM; *p < 0.05, **p < 0.01, ***p < 0.001.

