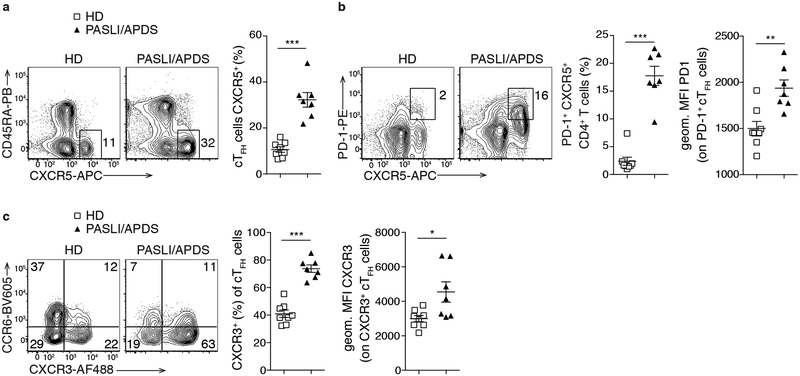
Fig. 1. Increased circulating TFH cells in PASLI/APDS patients.
Analyses of blood from healthy donors (HD n=8) and PASLI/APDS patients (n=7). a, Representative flow plots and histogram of CD45RA—CXCR5+ cTFH cells (percent of CD4+CD3+CD25— T cells). b, Representative contour plots and histogram of PD-1+CXCR5+ T cells (percent of CD4+CD3+CD25— T cells). Right: geometric mean fluorescent intensity (MFI) of PD-1 (gated on PD-1+ cTFH cells). c, Representative contour plots of CCR6+ and CXCR3+ cTFH cells and histogram of percent of CXCR3+ cTFH (of cTFH cells). Right: MFI of CXCR3 (gated on CXCR3+ cTFH cells). Data in (a-c) are represented as mean ± SEM with each dot indicating one individual. Significance analyzed by Mann-Whitney U test. *P < 0.05; **P < 0.01; ***P < 0.001.

