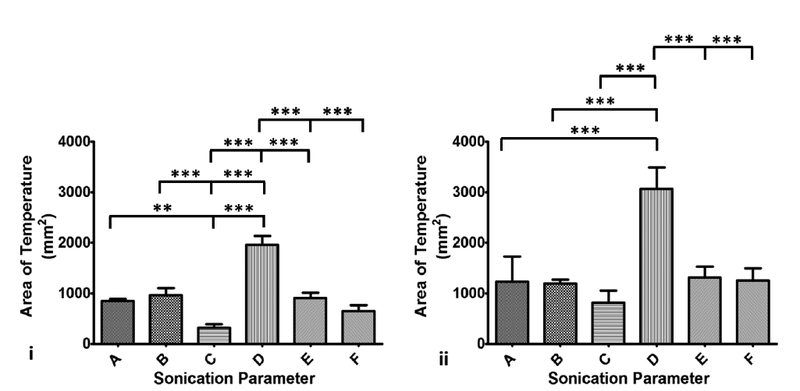
Figure 5.

Column chart showing area of temperature greater than 45°C along the coronal (panel i) and sagittal (panel ii) planes. Statistically different area of temperature was found between D and all other parameter sets, consistent with measurements made along the sagittal plane. Area of temperature was higher along the sagittal plane compared to the coronal plane since the focus region is longer along the sagittal plane than in the coronal plane.
