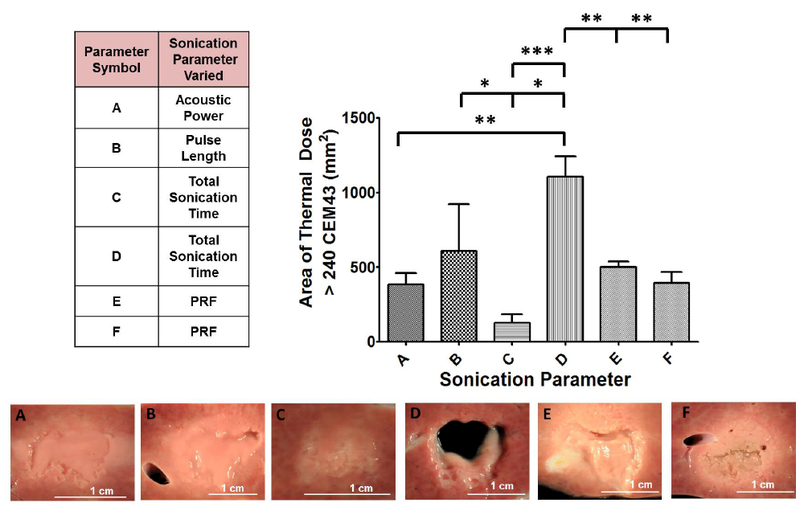
Figure 6.

Summary of the varied sonication parameters along with area of lethal thermal dose and corresponding gross pathology images of liver tissue. Area of thermal dose is quantified along the coronal plane and displayed in bar-graph format. Parameter set D was significantly different compared to all other parameter sets. There were additional differences between other sonication parameter sets. Although the area of lethal thermal dose was similar between parameter sets A, B, E, and F, the lesions produced were different in structure, as seen in the gross pathology images.
