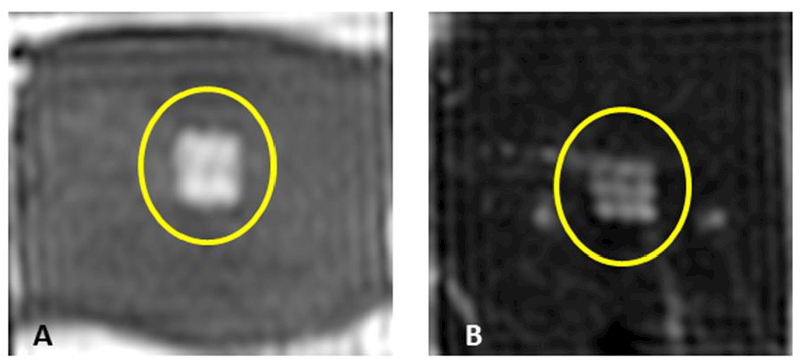
Figure 7.

Examples of T2-weighted MR images of ex vivo porcine heart and liver obtained post sonication using parameter sets A (panel A) and D (panel B). The images reveal a square-shaped hyperintense region (yellow circle) consistent with the square sonication grid pattern and with the square fractionated and partially liquefied lesion. Image in panel B also reveals nine spatially distinct points consistent with the sonication grid.
