
Figure 1.
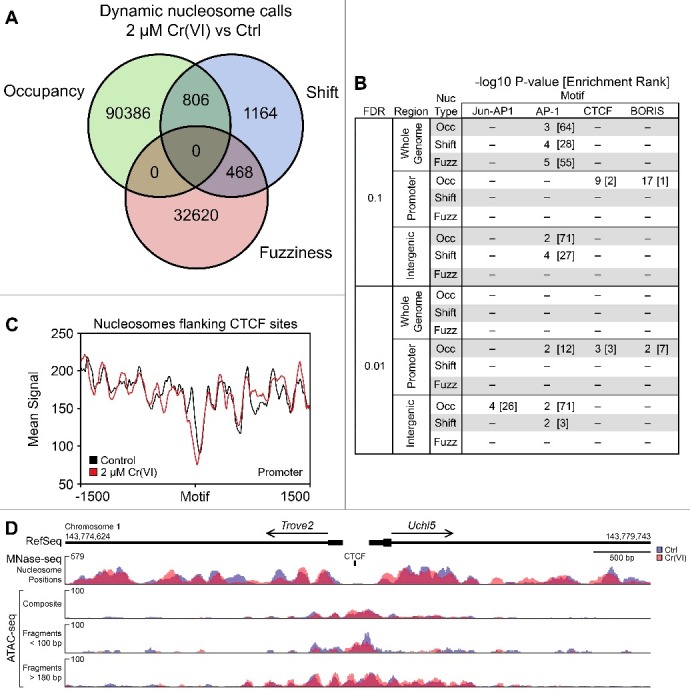
Occupancy of dynamic nucleosomes in promoter regions affects CTCF motif accessibility. Hepa-1c1c7 cells were treated with either H2O or 2 µM K2CrO4 for 72 hours before collection and monosome preparation by MNase digestion. (A) Represents dynamic nucleosomes that were called with the DaNPOS2 toolkit [34] with a threshold of q = 0.01. (B) Dynamic nucleosomes were analyzed for motif enrichment using HOMER [35] and separated based on genomic annotation at two different thresholds, q = 0.1 and q = 0.01. Enriched motifs are provided as the -log10 P value of the known motif, with its rank compared to other motifs listed in brackets. (C) CTCF motifs identified in promoters based on changes in nucleosome occupancy were extracted and motif orientation was corrected using previous annotations prior to generating average signal plots of nucleosome positions with deepTools2 Suite [57]. (D) The bidirectional promoter region between Trove2 and Uchl5 is provided to illustrate the complementarity between different sequencing techniques. Signal tracks in blue (control) and red (Cr-treated) represent either the nucleosome position generated using MNase-seq (upper panel) or ATAC-seq insert signal (lower panels). ATAC-seq tracks are represented using three separate criteria; “composite” is the average signal recorded for each bp with no insert-size filtering, while the middle track represents short inserts (less than 100 bp in length), and the lowest nucleosome-spanning inserts (greater than 180 bp in length).