
Figure 2.
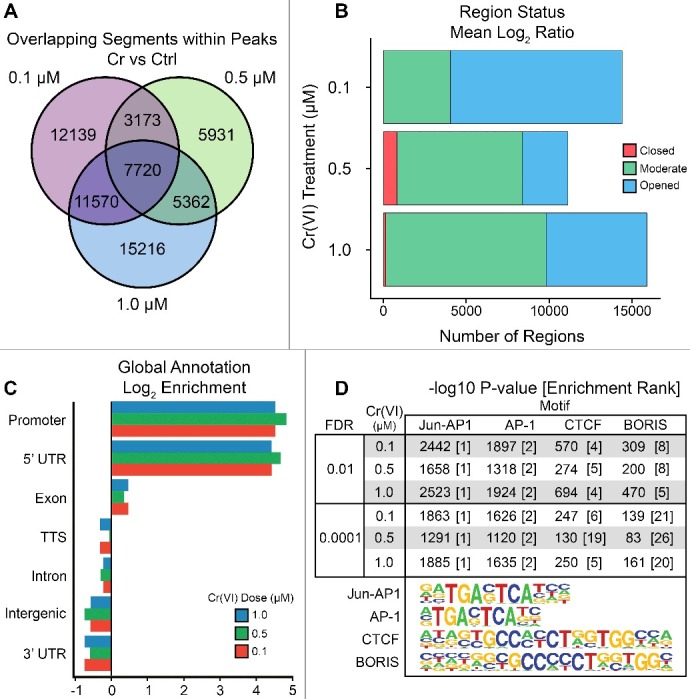
ATAC-seq identifies changes in chromatin accessibility associated with Cr(VI) exposure. Hepa-1c1c7 cells were treated with 0.1, 0.5, and 1.0 µM of K2CrO4 for 72 hours followed by nuclei isolation and addition of the Tn5-transposition reaction. (A) Differentially accessible peaks were called against an untreated control using MACS2 [52] with a threshold of q = 0.0001 and overlaps were calculated using the multiIntersectBed command in the Bedtools Suite [53]. The total number of input peaks for each treatment were 14,401, 11,130, and 15,894 for Cr 0.1, 0.5, and 1.0 µM prior to measuring the intersections. (B) Normalized log2 signal tracks comparing treated and control were generated using deepTools2 [57] with a bin size of 50 bp. Mean signal values were measured across normalized peak distances set to 1,000 bp for their respective treatments. Regions were considered to be significantly opened or closed following treatment if the mean was R ≥ 0.5 or R ≤ −0.5, respectively. (C-D) Each set of differentially accessible peaks was analyzed using HOMER [35] for annotation statistics and identification of significantly enriched motifs, listed as the –log10 P value of the known motif for ease of description [35]. The rank of enrichment for each motif logo is provided in brackets.