
Figure 3.
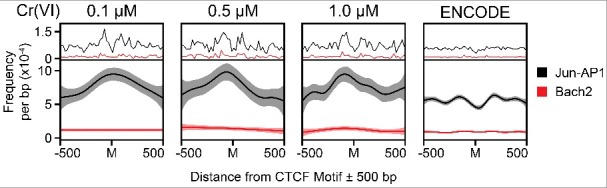
Proximal regions surrounding differentially accessible CTCF sites exhibit increased AP-1 motif density. CTCF sites were extracted from each set of differentially accessible peaks and subsequently used to measure the density of AP-1, Jun-AP1 and BACH2 motifs relative to each site ± 500 bp using HOMER [35]. The top panel represents the average frequency score for each motif in 20-bp bins. The panel below shows a smoothed model for the same data, generated using the smooth feature and generalized additive model method in ggplot2 [65] with no specified bin size. Jun-AP1 and AP-1 exhibit very similar trends among all conditions, thus only the Jun-AP1 results are shown. The number of CTCF sites represented in each graph from left to right is 1,354; 862; 1,525; and 21,901 respectively. ENCODE motif locations were derived from the adult CTCF ChIP-seq data, ENCSR000CBU.