
Figure 4.
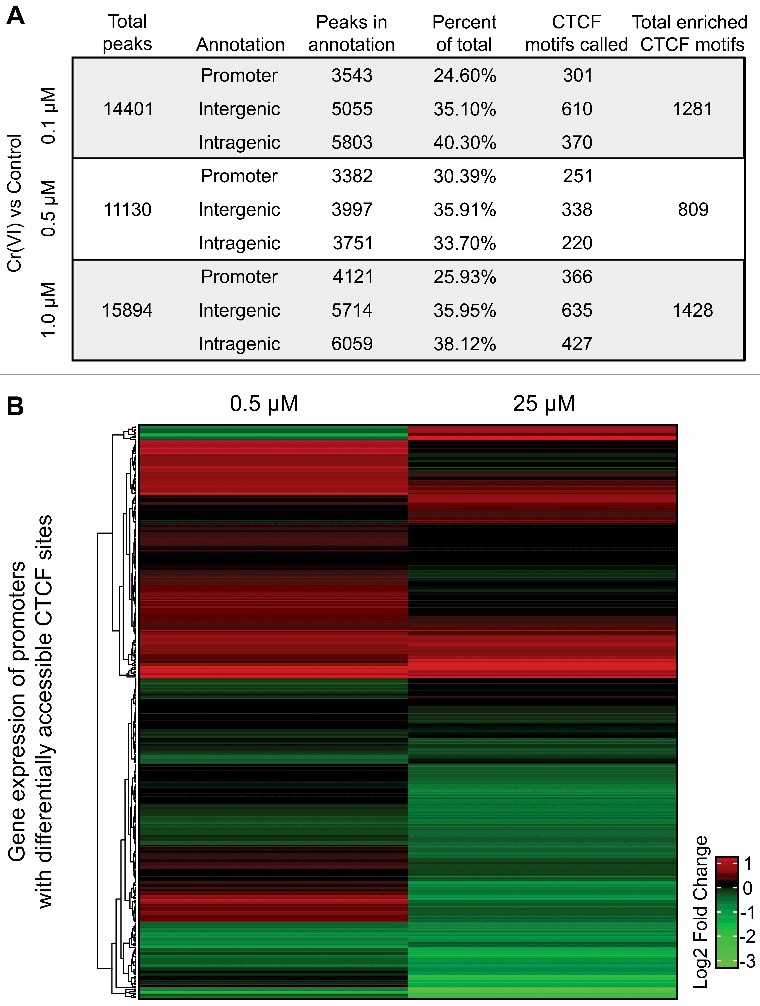
Differentially accessible CTCF motifs in promoters are associated with changes in expression. (A) The table describes the annotation statistics and CTCF enrichment analysis from HOMER [35]. Peaks were separated into “Promoter”, “Intergenic”, or “Intragenic” and compared to the total number of differentially accessible regions per treatment to estimate the percentage of peaks in each category. Additionally, the sum of peaks per category that contained one or more CTCF motifs are provided. (B) Peaks positive for the CTCF motif within ±1.5 Kb of a transcriptional start site (TSS) were selected and the closest gene ID was used to generate a list of 923 potential genes of interest. These were filtered to remove duplicate genes called by each treatment resulting in a total of 445 unique genes (see Supplemental Table 3). The log2 fold change values from previously published RNA-Seq datasets using doses of 0.5 µM or 25 µM K2CrO4 were used to assess changes in transcription for the filtered set of genes [23,33]; 400 of the 445 genes were annotated with expression values and each condition was independently analyzed back to controls in its respective experiment.