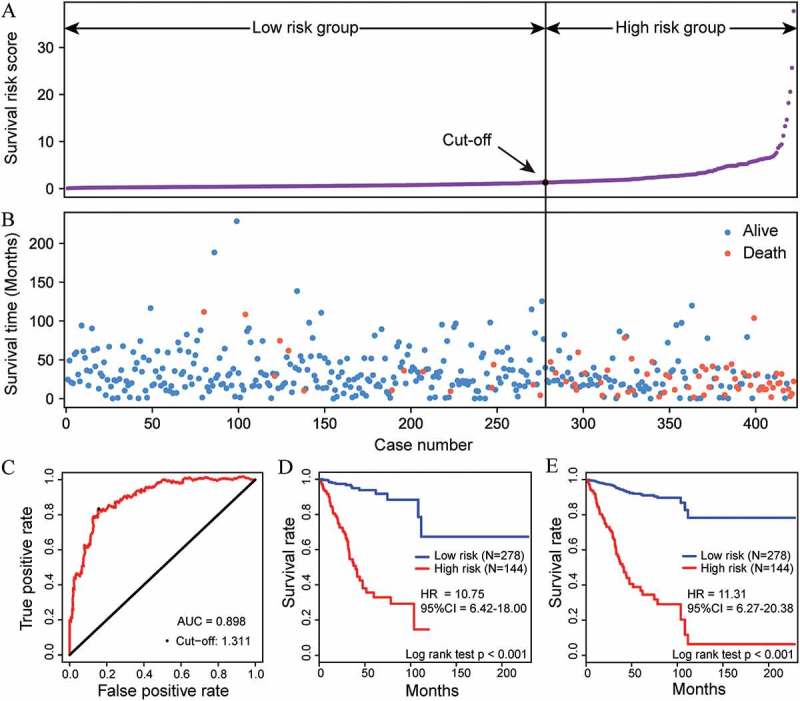
Figure 2.

Performance of the methylation prognostic model in the OS prediction of patients with EC. The distribution of survival risk score (A) and survival (or censoring) time (B) of EC patients in the entire EC cohort (n = 422). (C) The ROC curve was generated for 5-year OS predictions with an AUC of 0.898. An optimal cut-off value (1.311), shown as a black straight line in A and B, was obtained to divide the patients into low- and high-risk groups. Kaplan-Meier curves (D) and Cox proportional hazards regression prediction curves (E) were plotted to analyze the correlations between this model and OS, respectively. Patients in the high-risk group exhibited a poorer OS than patients in the low-risk group (all P <0.001).
