
Figure 5.
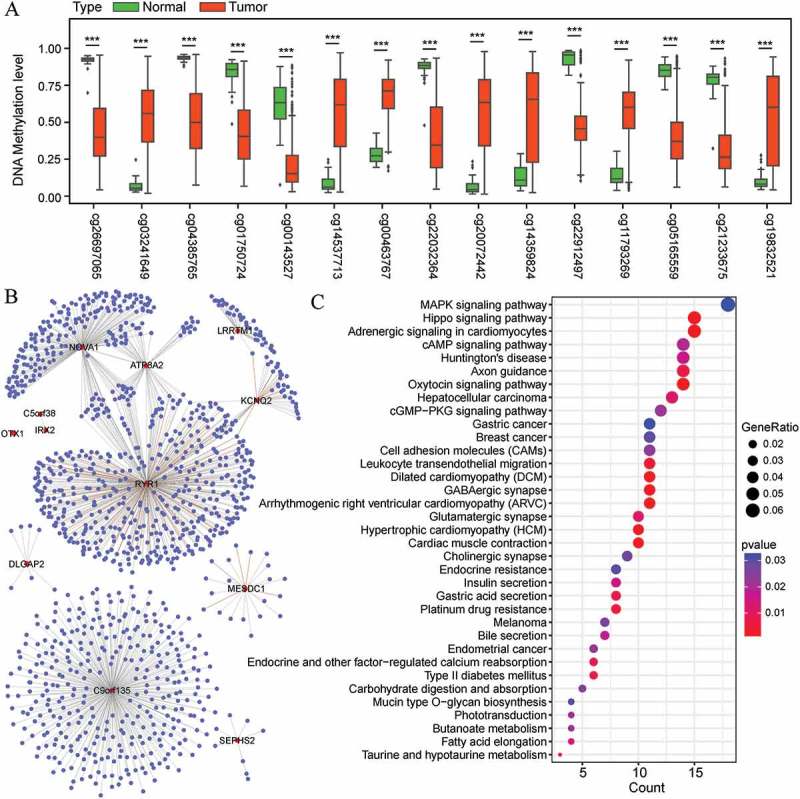
Differential methylation analysis of 15 selected markers and the co-expression analysis of their regulated genes. (A) DNA methylation levels of the 15 markers in 464 EC tissues and 46 normal uterine tissues. The distributions of the methylation level data are represented by box plots and the FDRs were calculated by COHCAP. (***FDR <0.001) (B) Cytoscape visualization of the co-expression of the 12 genes regulated by the 15 methylation markers with other genes (Pearson’s correlation coefficient >0.40) (C) Functional enrichment of the co-expressed genes in EC with the 12 annotated genes.