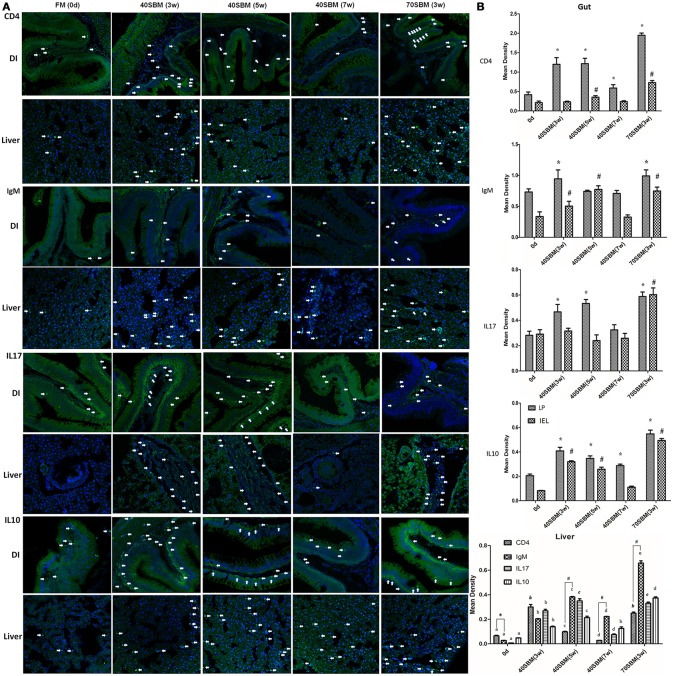
Figure 3.
Immunohistochemistry analysis for the main lymphocytes and key cytokines involved in SBMIE. (A) IHC results for IgM, CD4, IL17 and IL10 in the gut and liver in all time points in 40SBM group as well as 0 days in FM group (negative control) and 3 week in 70SBM group (positive control). The green signals represent the examined protein, while the blue signals (stained by Hoechst 33342) represent the nuclei. The white arrows points out typical immunohistochemistry signals. Scale bar: 30 μm. (B) The quantification of IHC signals in both the gut (left) and liver (right). In the gut, the significant (p < 0.01) increase of signals compared to the sample at 0 days in LP or in IEL was indicated by stars or hashes. In the liver, for each protein, the signals were calculated for significant changes, indicated by lowercase letters “a, b, c, d, e”. For each protein, the same label means no difference. For comparing T cell and B cell signals, CD4 and IgM signals were calculated for p-value at each time point, the significant (p < 0.01) more CD4 was indicated by the star, whereas the significant result for IgM (p < 0.1) was indicated by hashes.

