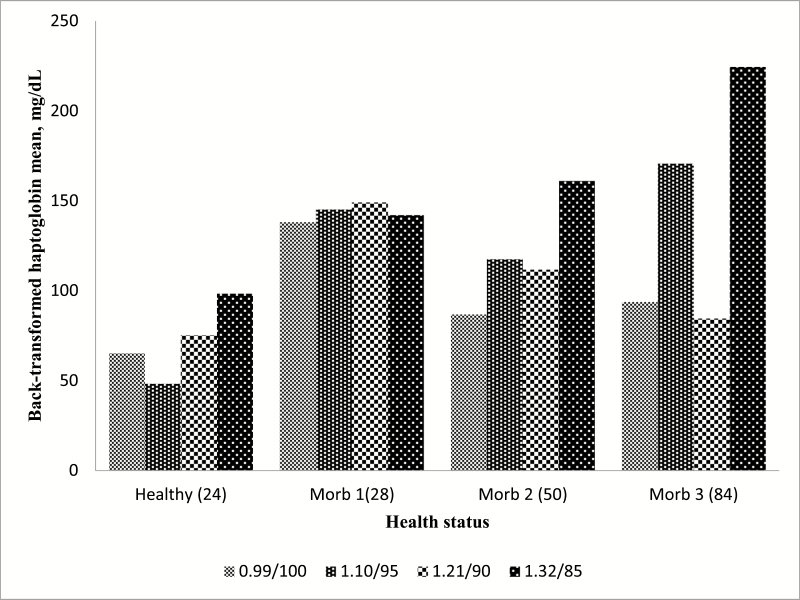
Figure 1.
Effects of dietary energy level and intake on haptoglobin concentrations in healthy and morbid animals. 0.99/100 = 0.99 Mcal NEg/kg DM offered ad libitum intake (100%). 1.10/95 = 1.1 Mcal NEg/kg DM diet limit-fed at 95% of 0.99/100. 1.21/90 = 1.21 Mcal NEg/kg DM diet limit-fed at 90% of 0.99/100 diet. 1.32/85= 1.32 Mcal NEg/kg DM diet limit-fed at 85% of 0.99/100 diet. Healthy = healthy pen mate pulled with sick animal for comparison (n = 71; SE = 24). Morb 1 = first pull for illness (n = 46; SE = 28). Morb 2 = second pull for illness (n = 15; SE = 50). Morb 3 = third pull for illness (n = 10; SE = 84). Health status effect (P < 0.0001), diet effect (P = 0.28), diet × health status effect (P = 0.83). Largest standard error reported between treatments.

