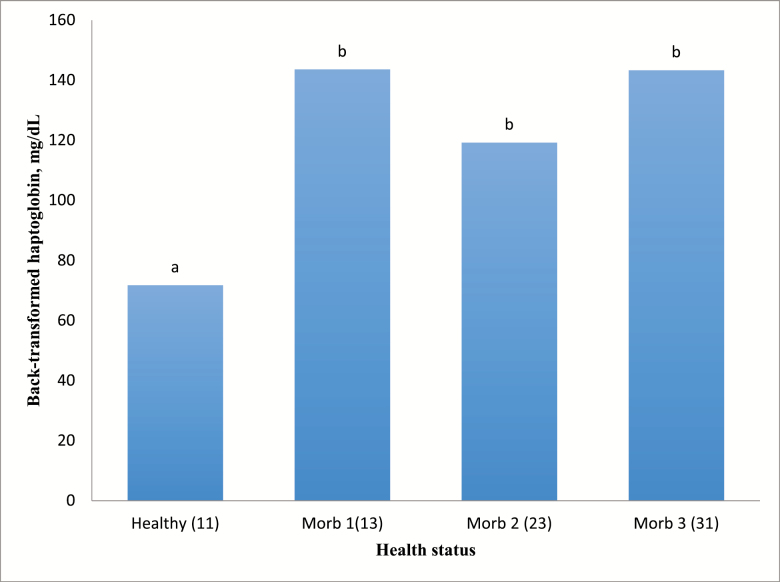
Figure 2.
Effects of health status on haptoglobin concentrations. Healthy = healthy pen mate pulled with sick animal for comparison (n = 71; SE = 11). Morb 1 = first pull for illness (n = 46; SE = 13). Morb 2 = second pull for illness (n = 15; SE = 23). Morb 3 = third pull for illness (n = 10; SE = 31). a,bUnlike superscripts above bars in chart differ (P < 0.05). Standard error reported after combining values between treatments.

