
Figure 3.
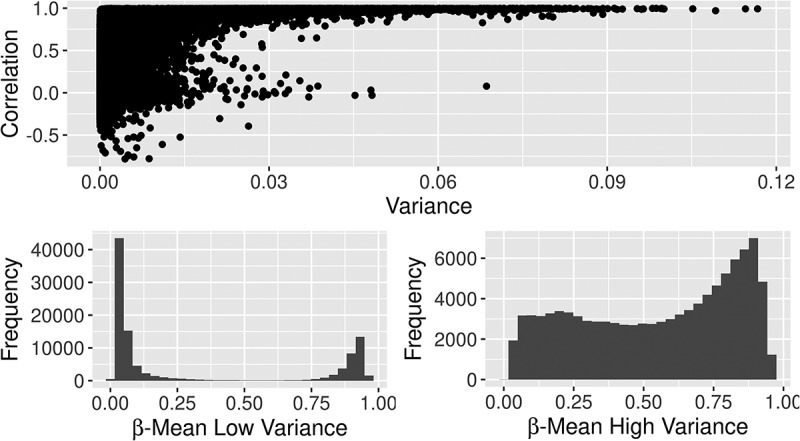
The correlation of β values between 450K and EPIC relative to the variance of methylation at each site (top). Sites in the lowest quartile of correlation had low variance and were mostly completely methylated or completely unmethylated (bottom left). Sites in the highest quartile of correlation had high variance of methylation (bottom right).