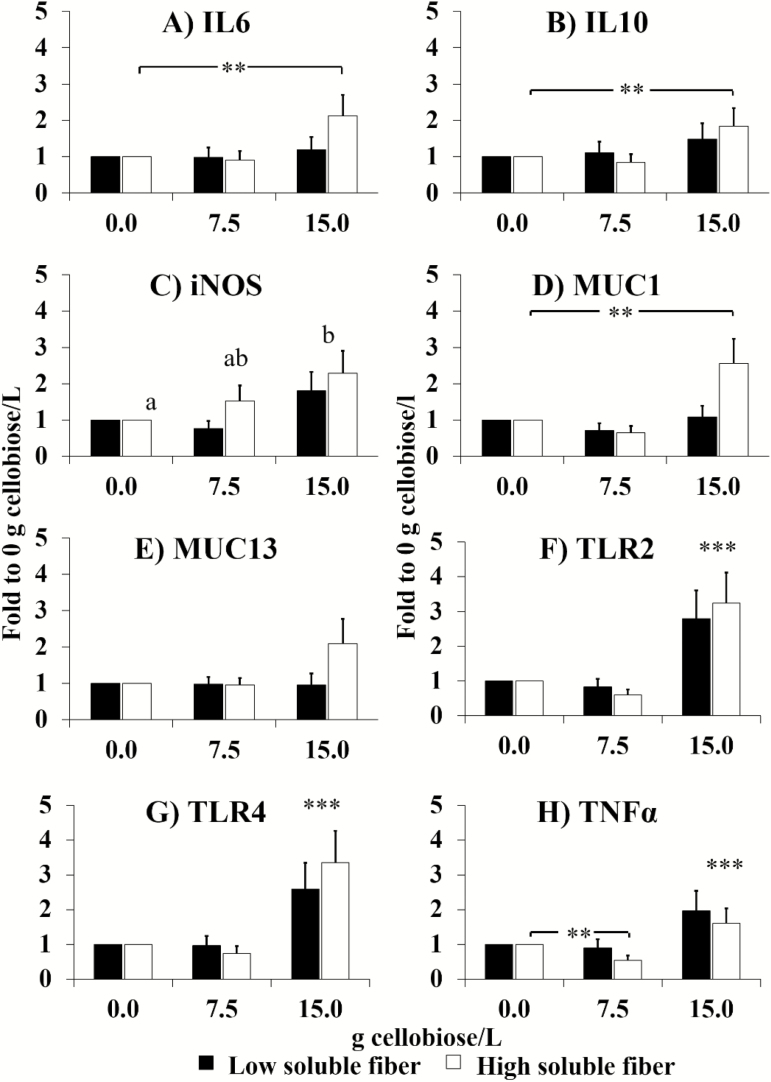
Figure 2.
Effect of the level of cellobiose in drinking water (0, 7.5, and 15 g/L) and dietary soluble fiber on mRNA levels interleukin 6 and 10 (IL-6, IL-10), inducible nitric oxide synthase (iNOS), MUC-1, TLR-2, TLR-4, and TNF-α. Relative gene expression values are fold change of 7.5- and 15-cellobiose groups relative to the 0-cellobiose (control), for each level of fiber. Bars indicate the 95% confidence interval (fold change up–fold change low). n = 8/treatment (**P < 0.01; ***P < 0.001). Lower case letters indicate differences of expression among cellobiose levels.

