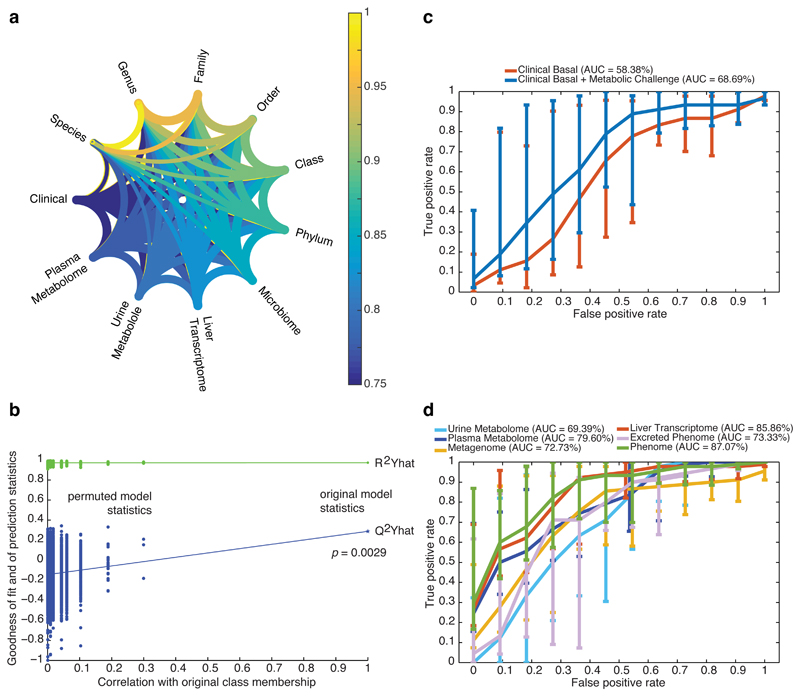
Figure 6. Phenome-wide crosstalk and predictive modelling.
a, Metagenome–phenome matrix correlation network computed for the patients with matching metagenomic and phenomic profiles (n = 56) using the modified Rv correlation matrix coefficient. Each phenomic table corresponds to a node and edges represent the relationships between tables, i.e., the per cent of shared information, derived from the Rv2 matrix correlation coefficient corresponding to the proportion of variance shared by the two tables – which like a squared Pearson’s correlation coefficient (r2) – corresponds to the proportion of explained variance between two variables. b, Discriminative power of a supervised multivariate model (OPLS-DA) fitted with patients with matching metagenomic and phenomic profiles (n = 56) to predict new samples, using random permutation testing (10,000 iterations). (c-d), Performance of classification of liver steatosis status (n = 10, vs. others, n = 46) based on clinical data (c) or matching molecular phenomic and gut metagenomic profiles (d). ROC curves (mean + 95% confidence interval) were obtained for the cross-validated model predictions derived from the O-PLS-DA model, reaching an AUC of 87.07%, corresponding to the successful prediction rate. Groups for all panels are: no steatosis (grade 0), n = 10; steatosis (grades 1-3), n = 46. Data are mean ± pointwise confidence bounds.

