Fig. 4.
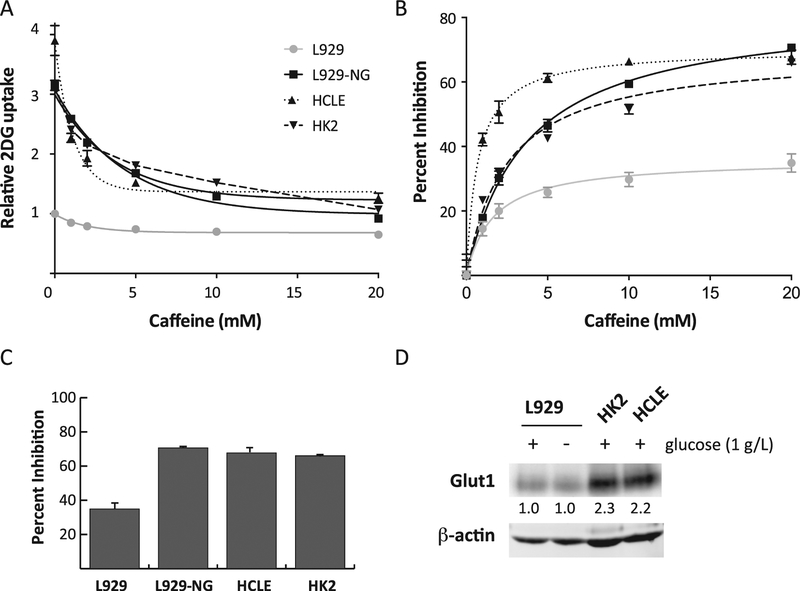
Caffeine inhibition in cells with higher GLUT1 activity. Panel A: Caffeine’s effect on 2DG uptake. 2DG uptake was measured in L929 cells, L929 cells activated by glucose deprivation (L929-NG), HCLE cells, and HK2 cells in the presence of 0, 1, 2, 5, 10, or 20 mM caffeine, and the results were normalized to L929 control cells at 0 mM caffeine and expressed as means of relative uptake ± S.E with best fit line to simple decay. Panel B: Percent inhibition. The uptake data from each cell type in Panel A were each normalized to their respective uptake at 0 mM caffeine, expressed as percent inhibition, and displayed as means ± S.E with best fit line. Panel C: Maximum effects of caffeine. Bar graph shows the percent inhibition ± S.E. of 2DG uptake at 20 mM caffeine. Panel D: GLUT1 Western blot. 75 mg of protein from cell extracts treated with PNGaseF of L929 cells treated with or without glucose, HCLE cells, and HK2 cells were separated by electrophoresis and probed with anti-GLUT1 and anti-actin antibodies as described. Numbers indicate fold change in GLUT1 normalized to actin compared to control (L929 + glucose).

