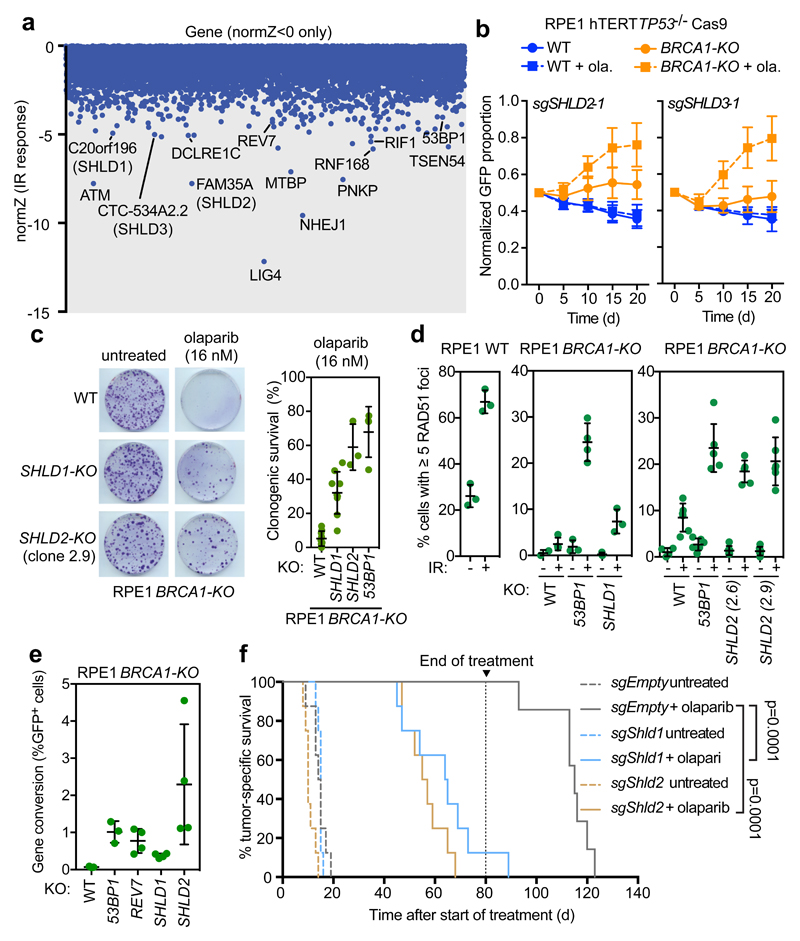
Figure 2. Shieldin loss promotes PARPi resistance in cell and tumor models of BRCA1-deficiency.
a, CRISPR dropout screen results in RPE1 WT cells exposed to IR. Shown are gene-level normZ scores <0. b, Competitive growth assays using olaparib (16 nM) in RPE1 BRCA1-KO cells. Data is presented as mean ± SD, normalized to day 0 (n = 3, independent transductions). c Clonogenic survival in response to 16 nM olaparib. Representative images are shown (left) and quantified (right). Bars represent mean ± SD (n=9: RPE1 WT and BRCA1-KO SHLD1-KO; n=3: BRCA1-KO SHLD2-KO, n=4: BRCA1-KO 53BP1-KO; biologically independent experiments). d, Quantitation of cells with ≥5 RAD51 foci ± 10 Gy IR (6 h recovery). Biologically independent experiments are shown and the bar represents the mean ± SD. From left to right, the number of replicates was n=3 and n=3 (left panel); n=3, n=4, n=3, n=4, n=3 and n=3 (middle panel); and n=4, n=6, n=6, n=6, n=6, n=6, n= 6 and n=6 (right panel) e, Assessment of gene conversion by traffic light reporter assay. Biologically independent experiments are shown and the bar represents the mean ± SD (n=3 for WT and 53BP1-KO; n=4 for SHLD1-KO, SHLD2-KO, and REV7-KO). f, Kaplan-Meier curve showing tumor-specific survival of mice transplanted with KB1P4 tumor organoids ± olaparib treatment for 80 d (n = 8 per treatment; editing efficiencies found in Supplementary Table 2). P-values were calculated using a log-rank test (Mantel-Cox).

