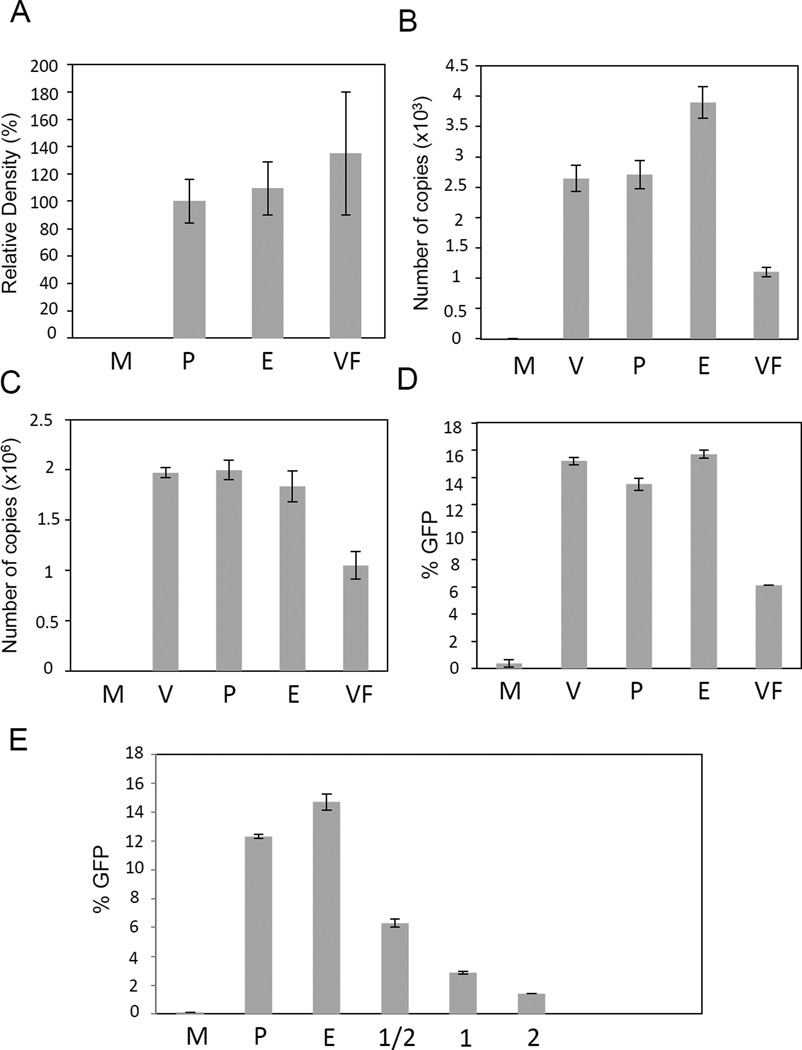
Figure 2.
Analysis of the VFE effect on the steps of the life-cycle of the HIV-1 vector. A. Analysis of the VFE effect on the entry step. This analysis was essentially done as described [12]. Briefly, 293T/17 cells were infected at an m.o.i. of 0.1 with VFE or controls. Cells were then washed and trypsinized to remove extracellular proteins, as described [12]. The intracellular p24 levels were then quantified using western blotting analysis and ImageJ analysis. M – mock-infected cells, P – cells infected with vector and PBS control, E – cells infected with vector and diluted ExoQuick reagent control, VF – cells infected with the vector and VFE. Relative density in %, B. Real-time PCR analysis of total virus DNA copies in infected cells. Cells were infected as described in Methods. One day post-infection DNA was extracted from infected cells and vector DNA copies quantified using real-time PCR. Real-time PCR was performed as described in the Methods. Samples labeled as in A, V – cells infected with vector only. C. Analysis of the integrated virus DNA in VFE-treated cells. Infections were performed as in B. Three days post-infection, genomic DNA was extracted. A nested Alu-PCR technique was conducted as described in the Methods and by us previously [22, 23]. Samples labeled as in B. D. Analysis of the HIV-1 mediated transduction of the GFP marker. Infections were performed as described in Methods. FACS was performed three days post-infection to quantify GFP expression. Samples labeled as in B. Error bars represent standard deviations. E. Repeated analysis of the HIV-1 mediated transduction of the GFP marker in the presence of increasing amounts of VFE. The highest amount is equivalent to double that used in Figure 2D. Samples labeled as in D, except the following: 1 – VFE used at the concentration that was used in Figures 2A–D, ½ - VFE diluted twofold, 2 – concentration of VFE increased twofold in comparison to Figures 2A–2D.

