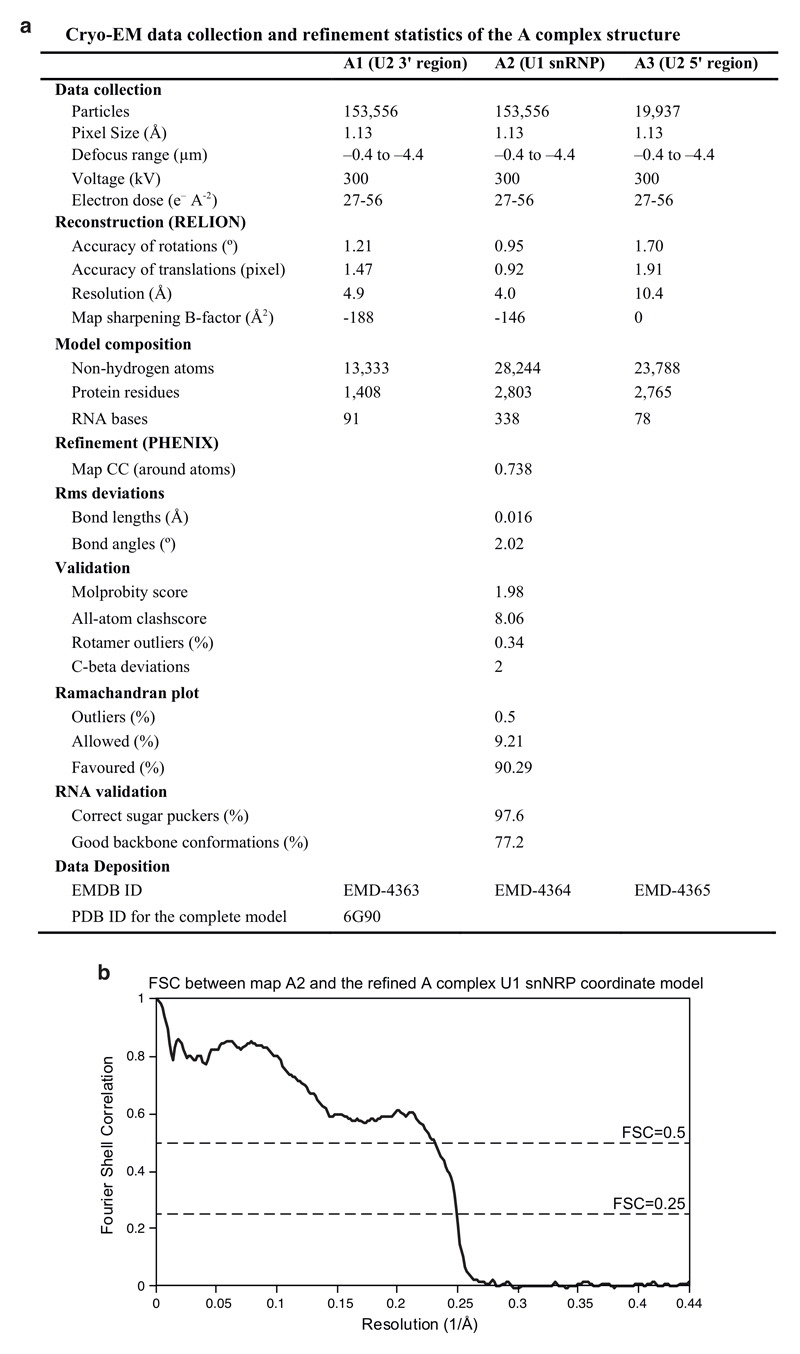
Extended Data Figure 9. Data collection, refinement statistics, and validation.
a. Cryo-EM data collection and refinement statistics of the A complex structure. Maps A1 and A3 were used to position the U2 snRNP 3' and 5' regions, respectively (see Methods). b. FSC between the A2 cryo-EM density and the refined A complex U1 snRNP coordinate model.

