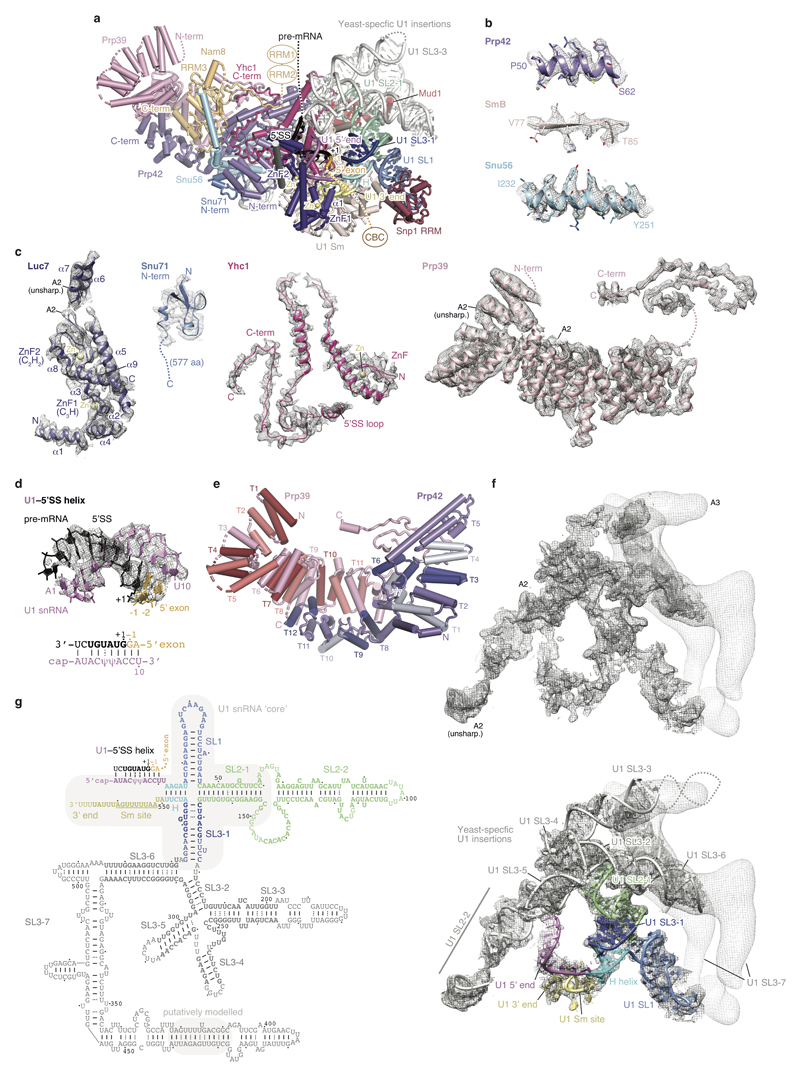
Extended Data Figure 3. Details of the U1 snRNP.
a. U1 snRNP structure with subunits coloured as in Fig. 1, except for Nam8 (orange), Snu56 (light blue), Snu71 (blue), Luc7 (dark purple), Mud1 (red) and U1 snRNA (various). The pre-mRNA nucleotides are labelled relative to the first nucleotide (+1) of the intron. The Nam8 RRM1 and RRM2 domains are flexible and project downstream of the 5'SS. The protein attributed to Luc7 in the free U1 snRNP structure12 was re-assigned to Snu71. Stem loop, SL; RNA recognition motif, RRM; Zn-finger, ZnF; N-terminus, N-term; C-terminus, C-term. In the structure we do not observe any evidence that the C-terminal tails of SmB, SmD1, and SmD3 interact with the 5’SS, consistent with their absence in the human 5’SS–minimal U1 snRNP crystal structure10. b. Representative regions of the sharpened U1 snRNP density determined at 4 Å resolution (map A2) are superimposed on the refined coordinate model. The density reveals side-chain details, and here segments from the Prp42 N-terminus (TPR repeat 1), the Sm ring subunit SmB, and the Snu56 α-helical domain are shown. c. The A2 cryo-EM density is shown superimposed on the coordinate models of a selection of U1 snRNP proteins: Luc7, Snu71, Yhc1, and Prp39. In the structure most of Snu71 is disordered, except for a small N-terminal domain (residues 2-43) that binds between the Prp42 N-terminus and the Snu56 KH-like fold, consistent with protein crosslinking12. Functional regions and disordered domains are indicated. d. The U1 snRNA–pre-mRNA 5' splice site (U1–5'SS) model is superimposed on its cryo-EM density (map A2). A secondary structure diagram of the U1–5'SS interaction is shown underneath the model. The register of the 5'SS is shifted by one nucleotide compared to the minimal human 5'SS–U1 snRNP crystal structure, due to an additional nucleotide in yeast U1 snRNA10 (U11). Lines indicate Watson–Crick base pairs and dots pseudouridine (ψ)-containing base pairs. e. The Prp39-Prp42 heterodimer is coloured to indicate each of their respective TPR repeats. f. Cryo-EM density of U1 snRNA from maps A2 (dark gray) and A3 (light gray) without (top) and with the superimposed coordinate model of yeast U1 snRNA (bottom). The model is labelled and coloured according to functional regions of U1 snRNA (5' end, pink; H helix, cyan; SL1, dark blue; SL2-1, green; SL3-1, light blue; SL2-2 and SL3-2 to -7, gray; 3’end and Sm site, yellow). Stem loop, SL. g. Secondary structure diagram of U1 snRNA. Bold letters indicate residues included in the model, lines indicate Watson–Crick base pairs, and dots G–U wobble and pseudouridine (ψ)-containing base pairs. Compare panel e. The conserved U1 snRNA ‘core’ is outlined with a gray box. The region of the putative phosphate backbone model of part of the U1 SL3-7 region is indicated with a gray box.

