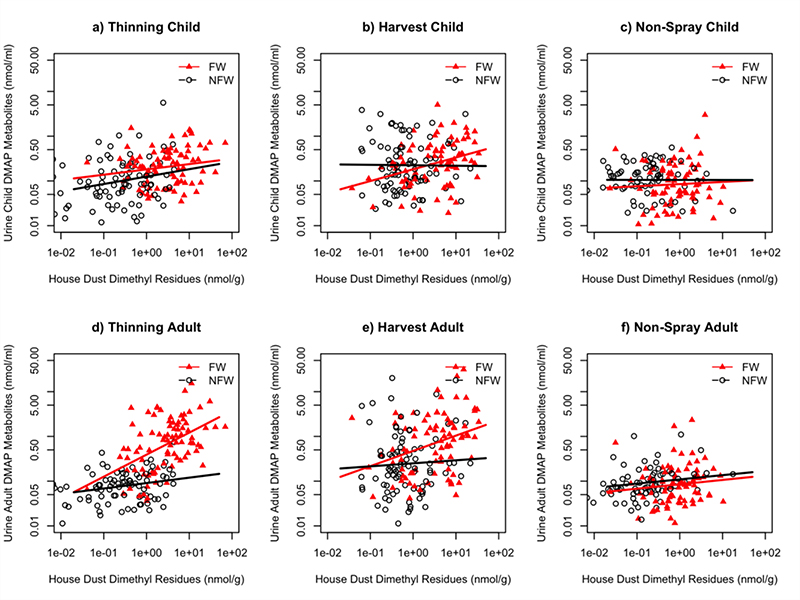
Figure 4:
Regression of log of DMAP urinary metabolites (nmol/mL) vs. log of dimethyl OP residues in house dust (nmol/g) by agricultural season, with regression lines calculated separately for the two occupational groups. All figures include samples with residue levels below LOD. (3a) Difference between FW and NFW children in thinning season: p<0.001. (3b) Difference between FW and NFW children in harvest season: p<0.05. (3c) Difference between FW and NFW children in non-spray season: p=0.62. (3d) Difference between FW and NFW adults in thinning season: p<0.001. (3e) Difference between FW and NFW adults in harvest season: p<0.001. (3f) Difference between FW and NFW adults in non-spray season: p=0.33.

