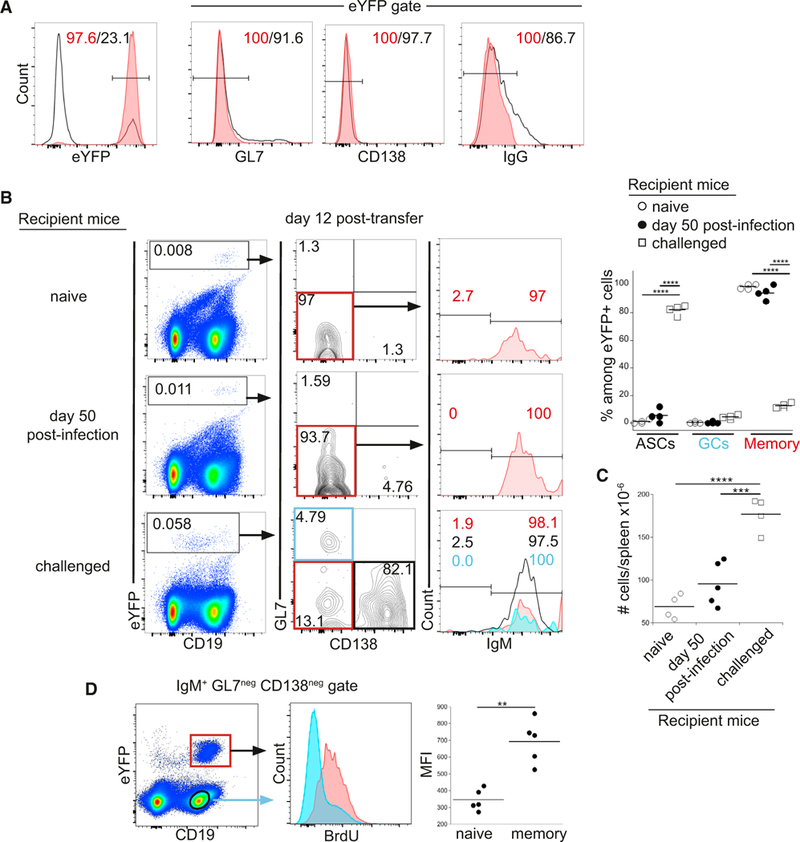
Figure 2. IgM Memory Cells Differentiated Only after Challenge Infection.

(A) Purification ofIgM memoryBcells. eYFP+GL7neg CD138neg IgGneg splenic B cellswere purified by flow cytometry; representative dot plots show expression of the indicated cell surface markers among the eYFP+ cells prior to (open histograms) and after (red histograms) purification.
(B) Purified IgM memory cells were transferred into naive mice (top panels), mice infected for50 days (middle panels), or naive micethat were challenged at the time of cell transfer; each of the groups of recipient mice were analyzed 12 days post-cell transfer. eYFP+ donor cells (gated in plots on left) were analyzed for expression ofGL7 and CD138 (middle plots). Expression of IgM was analyzed in GL7neg CD138neg memory cells (plots on right; red histograms); analyses ofthe GL7neg CD138+ASCs(bottom right plots; open histogram) and GL7+ CD138neg GC cells(blue histogram) are shown only for the challenged mice. The percentage of eYFP+ cells in each ofthe populations in the recipient mice is quantified in the plot on right. Statistical significance was determined using an ordinary one-way ANOVA (p < 0.0001; F = 948.2; df = 35) and a Holm-Sidak’s multiple comparison test.
(C) Spleen cell numbers in the mice analyzed in (B) are shown. Statistical significance was determined using an ordinary one-way ANOVA (p < 0.0001; F = 28.7; df = 12) and with Tukey’s multiple comparison test. The data in (A)-(C) are representative of one experiment that used 4 or 5 mice per group.
(D) Recipient mice were administered BrdU from day 14to21 following transferofT-cell-depleted splenocytes from infected (AID-Cre-ERT2 × Rosa26 eYFP) F1 mice; the recipient mice were infected immediately following cell transfer. Spleen IgM+, GL7neg and CD138neg, CD19+ B cells were analyzed on day 21 for BrdU incorporation. Aggregate data are shown in the panel on the right. Statistical significance was determined using a two-tailed paired t test (p = 0.0019; t = 7.289; df = 4).
In (C) and (D), **p < 0.01, ***p < 0.001, and ****p < 0.001.
