
Figure 6. IgH Chain Repertoire Analyses of Differentiated IgM Memory Cells.
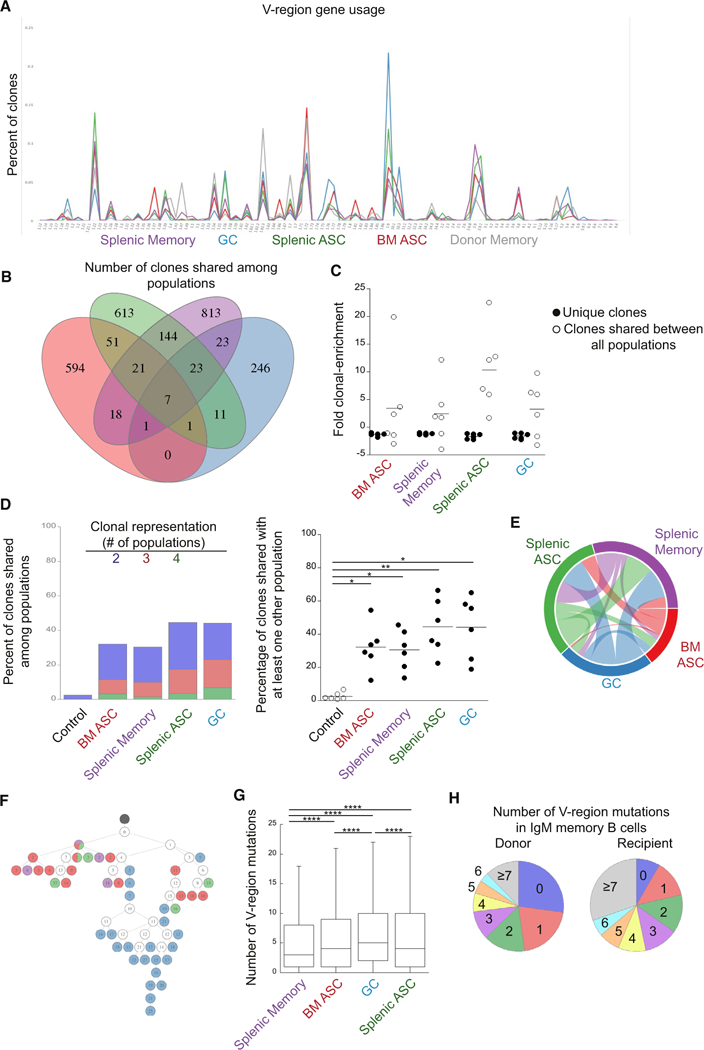
IgSeq analysis was performed on B cell populations generated from transferred IgM memory B cells.
(A) Frequency of IgH V-gene usage in the donor IgM memory population and each IgM memory cell-derived B cell population. V-regions are indicated on the ordinate.
(B) A Venn diagram is shown that illustrates the number of clonotypes shared among B cell populations in a representative mouse. Regions of overlap represent the number of clonotypes shared between the overlapping populations.
(C) Clonal enrichment. The plot on the right shows the fold clonal enrichment (i.e., the clonal frequency divided by the expected frequency; assuming equal representation) of clones unique to each population and clones identified in all effector populations. For frequencies less than one, the negative reciprocal was plotted.
(D) Percent of clonotypes shared among B cell populations. The blue bar segments represent the frequency of clones within each population that were also found in one other population; the red bars represent clones found in two other populations, and the green bars represents clones found in three other populations. The plot on the right shows the percentage of clones shared between at least one other population within an individual mouse. Each mouse was compared to a different recipient mouse from a different time point (control). Statistical significance was determined using a RM one-way ANOVA (p = 0.0008; F = 16.92; df = 29) with Dunnett’s multiple comparisons test.
(E) A Circos plot representing the clonal overlap in pairwise comparisons of the different B cell populations is shown.
(F) A lineage tree illustrating common clones identified in all of the isolated B cell populations. Black circles represent a germline clone, and white circles represent inferred clones. Daughter clones are shown in color, based on the effector population from which they were identified. The number of mutations from germline is indicated by the number shown in each circle.
(G) The number of replacement and silent mutations, from germline, in the V-region of the indicated populations is shown. Statistical significance was determined by an ordinary one-way ANOVA (p < 0.0001; F = 1244; df = 145,175) with Tukey’s multiple comparisons test. ****p < 0.0001.
(H) The percentage of clones with the indicated number of replacement and silent mutations in the V-region of the IgM memory donor population (left) and the IgM memory recipient population on day 27 post-challenge (right) is shown. Outliers have been removed for clarity. All data of the recipient mice are from 2 experiments with 3 mice per group. The donor population is representative of two experiments with three pooled mice per experiment.