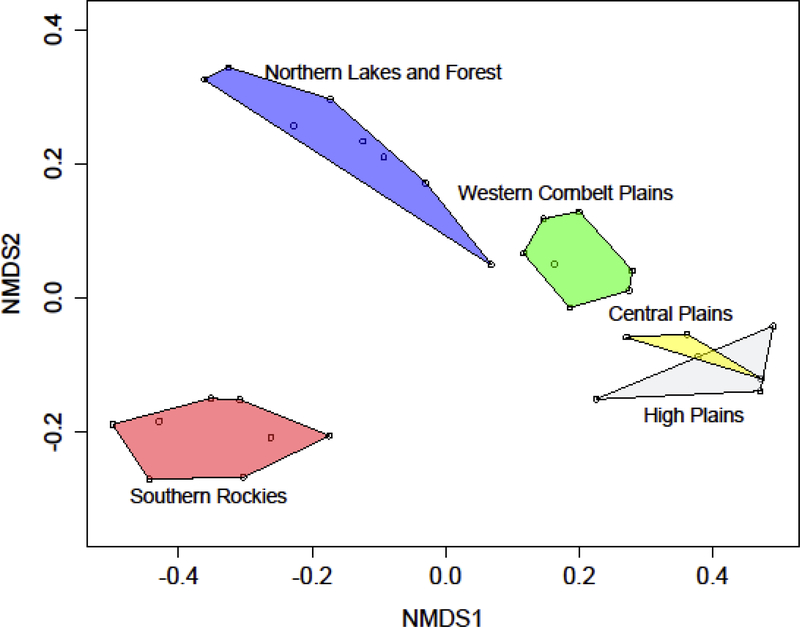
Figure 5.
Ordination plot for the BBS avian community data (k = 2, stress = 0.080). The BBS routes are shown with open circles, while the polygons contain all the routes that fall into the ecoregions (Omernik 1987). The overlap between the High Plains and the Central Plains suggests that these two ecoregions do not substantially differ in avian community structure.

