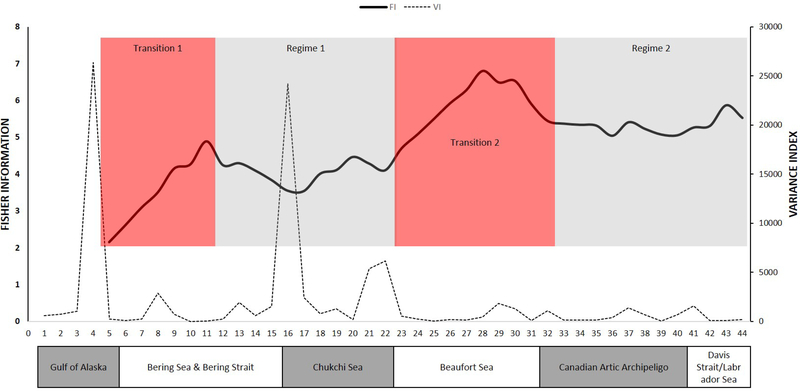
Figure 6.
Fisher information (FI; bold solid line) and Variance Index (VI; faint dotted line) for zooplankton community data collected from 44 stations along a transect that begins in the Pacific ocean, traverses the Arctic, and ends in the Labrador Sea (numbered from 1 to 44 and ordered from west to east along the x-axis). Because one FI value is produced per window, the first FI value is at route 5. The regimes and transition zones identified by FI are shown as boxes drawn around the FI plotted line. The a priori-defined oceanic domains are under the x-axis, to see how well the location of the regimes identified by FI align with the oceanic domains identified in the literature.

