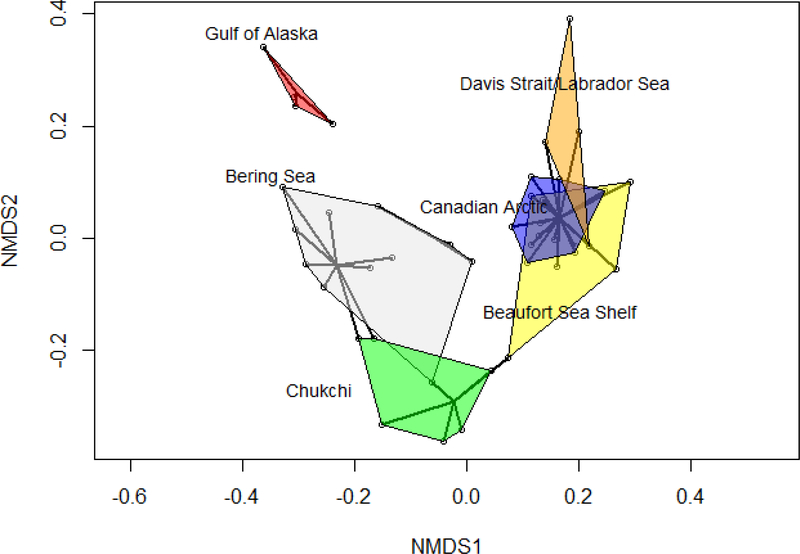
Figure 8.
Ordination plot for the zooplankton community data (k = 3; stress = 0.121. The sampling stations are shown with open circles. The results of a cluster analysis (pruned to 6 clusters) are shown with black spiders, while the oceanic domains a priori identified from the literature are represented by the colored polygons. Both the nMDS and the cluster analysis fail to assign some sampling stations to the ‘correct’ oceanic domain for all domains except the Gulf of Alaska.

