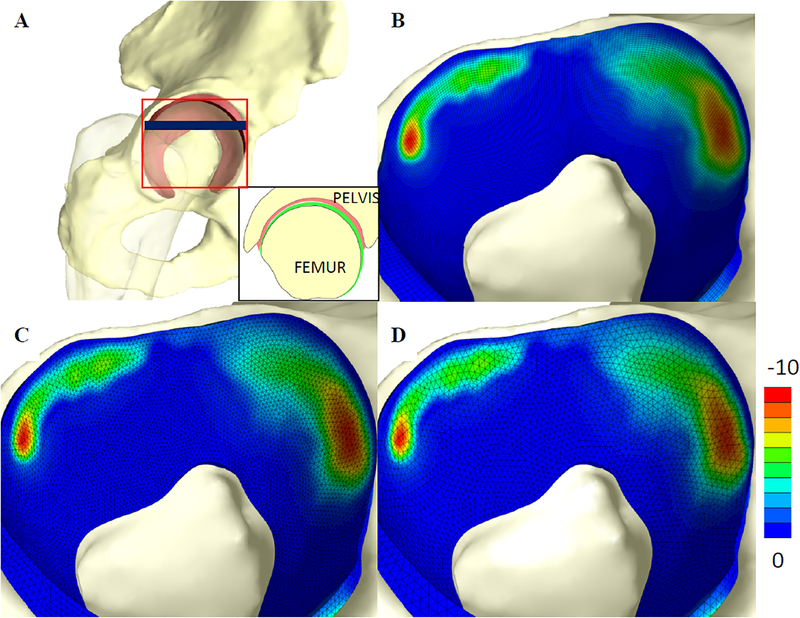
Figure 7:
A) Finite element model of the human hip, including the acetabulum, proximal femur and articular layers on the acetabulum and femoral head. Red square shows approximate area corresponding to contour plots. Blue line shows approximate location of inset, showing cross-section of model B-D) Fringe plots of 3rd principal stress for the acetabular cartilage discretized with B) HEX8 elements, C) TET10 elements, and D) TET15 elements. There was very good agreement between the 3rd principal stress and contact area predicted by the three models.

