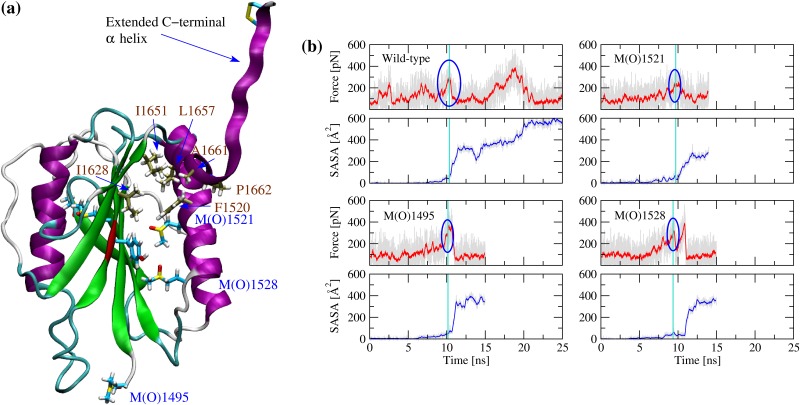
Fig 6. Pulling simulations and undocking of the C-terminal α helix.
(a) Snapshot saved after ca. 10 ns of a pulling run where all methionine residues are oxidized (MetAllO_pull_1). The methionine sulfoxide residues located in the vicinity of the C-terminal α helix are labeled in blue. The residues forming the C-terminal hydrophobic core are labeled in brown and their carbon atoms are colored in tan for distinction. The backbone of the proteolytic site is colored in red. This snapshot represents the event where the C-terminal hydrophobic core becomes exposed to solvent and the C-terminal α helix separates from the rest of the protein. (b) Time series of the applied force and SASA of the C-terminal hydrophobic core (first set of runs). Blue circles highlight the force peak at which the C-terminal helix completely separates from the rest of the protein. The magnitude of the force peak was determined by identifying the time point when the SASA of the C-terminal hydrophobic core exceeds 50 Å2 (indicated by a vertical cyan line) and searching for the highest value of the force within a 400 ps time window. Running averages over 20 ps are indicated in red for the force and in blue for the SASA, respectively. The time series with the unoxidized with-type are taken from a previously published study (WT_pull_1) [9]. Replicas of the simulations presented in these plots and pulling simulations with all methionine residues oxidized are presented in S5 to S7 Figs.

