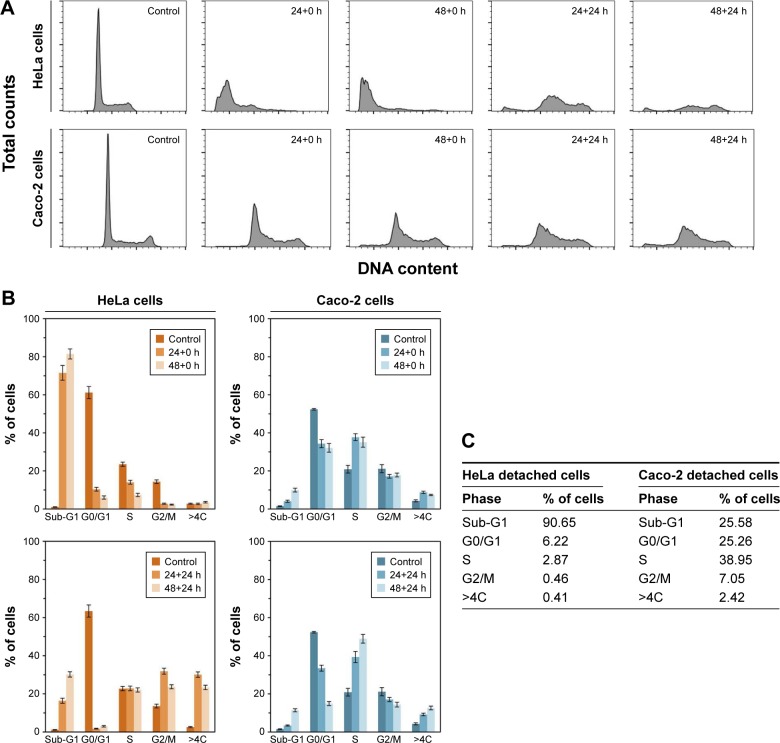
Figure 6.
Flow cytometry analysis of cell-cycle phase distribution.
Notes: Cell-cycle phase distribution was analyzed after incubation with SN-38lip (10 µM) for 24 and 48 h. (A) HeLa (upper panels) and Caco-2 (lower panels) cells. Cell-cycle profiles were acquired for non-treated cells (control) and immediately (24+0 h, 48+0 h) after treatment and 24 h after drug removal (24+24 h, 48+24 h). For comparative purposes, typical profiles that were acquired while maintaining the same scale for total counts (y-axis, from 0 to 1,100) and DNA content (x-axis, from 0 to 256), are shown. (B) Percentage of cells in each cell-cycle phase calculated from the histograms. (C) Percentages of detached cells in each phase. For each experiment, a minimum of 20,000 events were analyzed.

