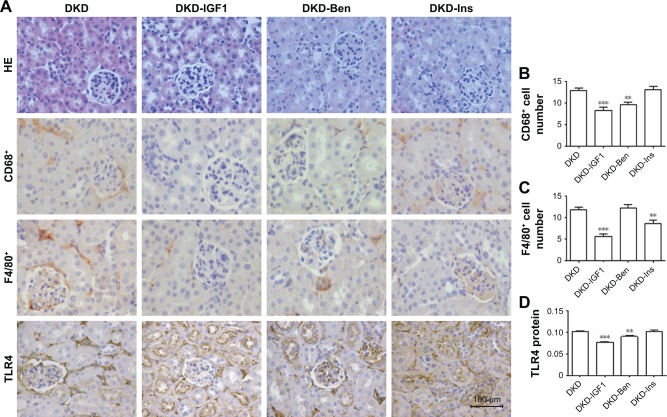
Figure 5.
Metabolic parameters and histological changes on different treatments.
Notes: (A) HE staining, CD68+ cells, F4/80+ cells, and TLR4 proteins stained in kidney sections to represent kidney histology by immunohistochemistry (scale bar=100 μm, magnification 400×). Molecular inflammation changed in kidney tissue. Data analysis of (B) CD68+ cells, (C) F4/80+ cells, and (D) TLR4 proteins. **P<0.01; ***P<0.001; one-way ANOVA followed by Tukey’s multiple comparison test.
Abbreviations: DKD, diabetic kidney disease; Ben, benazepril; Ins, insulin.

