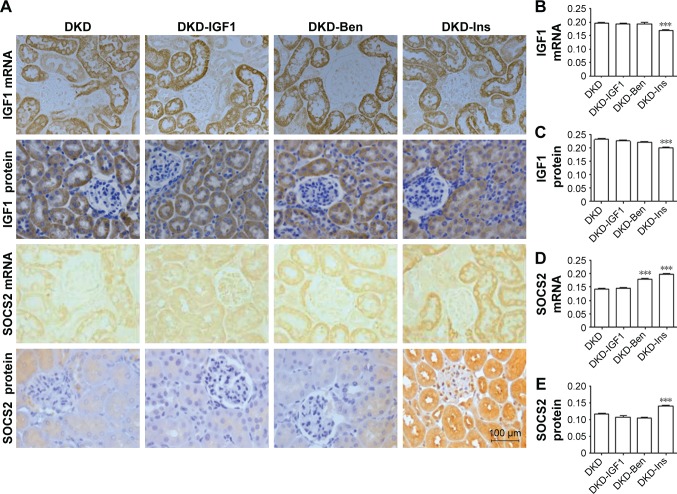
Figure 7.
SOCS2 and IGF1 protein- and mRNA-expression levels in the kidney on different treatments.
Notes: (A) Expressions of SOCS2 and IGF1 by immunohistochemistry and in situ hybridization (scale bar=100 μm, magnification 400×). Data analysis of (B) IGF1 mRNA, (C) IGF1 protein, (D) SOCS2 mRNA, and (E) SOCS2 protein. ***P<0.001; one-way ANOVA followed by Tukey’s multiple comparison test.
Abbreviations: DKD, diabetic kidney disease; Ben, benazepril; Ins, insulin.

