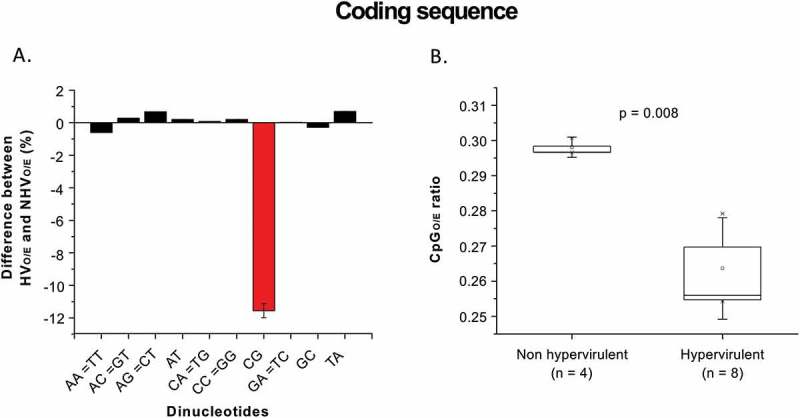
Figure 2.

(a) Within the coding regions CpG dinucleotides are the most variable dinucleotides between hypervirulent and non-hypervirulent C.difficile strains: The difference in dinucleotide O/E ratios between hypervirulent (HV) and non-hypervirulent (NHV) C.difficile strains within the coding region (in percentage) is shown in the Y-axis (A positive value for a given dinucleotide implies higher O/E ratios for the hypervirulent strains as compared to the non-hypervirulent strains). The differences between the hypervirulent and the non-hypervirulent strains were less than 1% except for the CpG dinucleotide for which the difference is about 11.5% (red bar). (b) Within the coding region CpG depletion is more pronounced in the hypervirulent C.difficile strains as compared to the non-hypervirulent strains: Box-plot diagram showing the CpG (O/E) in the coding region in non-hypervirulent and hypervirulent strains of C.difficile. The relative abundance of CpG dinucleotides was significantly lower in the hypervirulent strains (Median = 0.263) as compared to the non-hypervirulent strains (Median = 0.298) [p < 0.05].
